HostMonitor provides set of profiles to make configuration easy and flexible:
| Schedules | - | used as a time restriction for the test or action execution. |
| Color schemes | - | customizable color palettes for the interface of the program, HTML logs, and reports. |
| Mail templates | - | multiple message templates are used for the e-mail, pager and ICQ notification. |
| Report profiles | - | allows you to create and customize reports in a variety of ways. |
| Action profiles | - | defines set of actions to respond to failed services. |
To configure profiles use Profiles menu in HostMonitor's main window.
| Schedules |
Purpose of schedules: time restriction for a test or an action execution.
For example, if you want to check your server only from Monday to Friday select the "Monday-Friday, 24 hours" schedule
in the Test Properties dialog. If you do not specify a schedule for a test, HostMonitor
will check the host 24 hours per day, 7 days per week (using the interval specified when you created the test).
Also Schedules can be applied to actions the same way they were used for tests. With schedules, actions can be
customized per time of the day. For instance, an action profile can be set up to page both the IT manager and the
network administrator during regular office hours, and to page the administrator alone the rest of the time, while
doing nothing else but writing to the log on weekends. To make this possible, simply check the "Time restriction" option
in the Action Properties dialog and select an appropriate schedule.
You can create your own schedules and modify standard schedules using Schedules dialog. To bring up this dialog use
menu Profiles->Schedules or appropriate buttons in the Test Properties and
Action Properties dialogs.
 As you can see, editing schedules is very easy. To manipulate with the list of schedules use 4 buttons:
New
Create new schedule
Copy
Make a copy of selected schedule
Rename
Change name of the schedule. You can rename schedules without having to worry that the link between the test and the profile will be broken. To link tests, actions and profiles HostMonitor uses internal IDs that are unique and non-changeable throughout the lifetime of an object.
Delete
Remove selected schedule
| Popup menu items provide access to additional options: | |
| Sort by | Option allows you to sort profiles by name or creation time. |
| Columns | Use this option to change the number of columns (1,2 or 3) for the list of profiles. |
| Usage report | This option shows usage report for selected profile. It tells you where profile is used (test items, HostMonitor scheduler, folders, logging alerts, etc). |
| Mark unused | If you enable this option, profiles that are not currently in use will be displayed in grey color. |
| To edit a schedule, select the time region (using the left mouse button) and click one of the buttons: | |
| Check | Marks the selected time interval as 'Allowed' for the start of tests and actions (highlighted in green) |
| Uncheck | Marks the selected time interval as 'Not allowed' for the start of tests and actions (highlighted in red) |
| Invert | Changes time interval to an opposite ('Allowed' becomes 'Not allowed' and the other way around) |
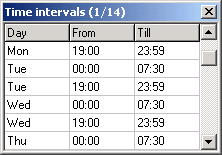 Tune
TuneYou may define schedules with up-to-the-minute precision. To use this feature click on "Tune" button or select "Edit intervals" item from popup menu. In a popup window appearing, you will be able to check and modify list of time intervals. To change "From" or "Till" time just type new time, to change day of the week press F2 and select day from drop-down list or type one of the following words to specify day of the week:
- Mon, Tue, Wed, Thu, Fri, Sat, San, Holiday
- type the word 'any'. HostMonitor will replicate time interval for every day of the week (including holidays)
- type the word 'work'. HostMonitor will replicate time interval for Monday-Friday
- type set of day numbers, e.g. '123' (Monday..Wednesday) or '12345678' (Monday-Sunday and Holidays) and so on
Holidays
Also you may specify separate schedules for holidays. The list of holidays is available for modifications for years
ahead. Click "Holidays" button and HostMonitor brings up dialog window with the one year calendar that has all
holidays marked by red background. To mark or unmark any day as a holiday select a day and press Space key.
To see/modify holidays for another year, select a year using "up-down" control at the bottom of dialog.
Use "Clear All" button to clear the list of holidays (holidays for current, all past and future years will be unmarked).
| Color palettes |
You can use fully customizable color schemes for the program's interface, for HTML log files and HTML reports. For
different folders and reports you can use different color palettes. For example, a report designed for the IT manager
might have an entirely different look and feel as compared to the one intended for use by the network administrator.
Similarly, reports designed for the field offices may differ in palette from those used by the headquarters.
The following elements have customizable color attributes (you can change both fore- and background colors):
- underlying layer;
- table header (HTML reports/logs only);
- folders;
- system messages (HTML logs only);
- HTML links (HTML reports/logs only);
- test colors are status-dependent, so you can use different colors to display tests with different statuses:
- "Not testes yet";
- "Good" items;
- "Bad" items;
- "Unknown" tests;
- "Warning" test items;
- Acknowledged "Bad", "Warning" or Unknown" test items;
- "Checking.." items (when "Checking status should not alter the colors" option is disabled);
- "Disabled" tests;
- "Waiting for master";
- "Out of schedule" test items.
- "Not testes yet";
If you plan to use palette for SLA reports with charts, set profile name starting with "SLA " or "SLA-" (case insensitive, e.g. "Sla Blue palette", "SLA-White"). In such case HostMonitor will show special sample.
To choose a palette that will be used in the program's interface, use Interface page in the User Preferences dialog; you can select the palette for HTML logs on the HTML Colors page in the Options dialog; use Report Manager to choose color schemes for HTML reports.
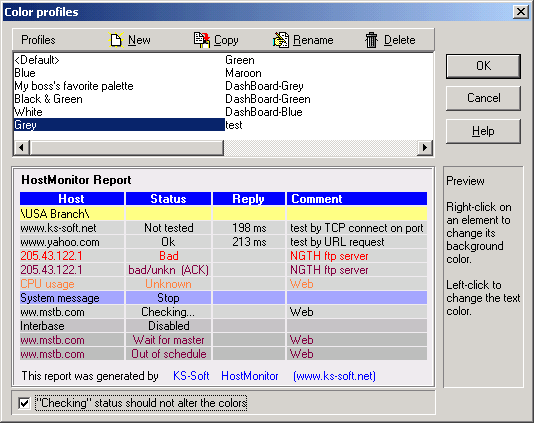
Color schemes are created and edited in the Color Profiles dialog:
To manipulate with color schemes use 4 buttons:
| New | Create new palette. |
| Copy | Copy selected palette. This is useful if you want to make small modifications for the existing color palette. |
| Rename | Change palette's name. You can rename palettes without having to worry that the program will loose the link to the palette; HostMonitor uses internal IDs that are unique and non-changeable throughout the lifetime of an object. |
| Delete | Remove selected palette (you can remove any color scheme except 1st one with name <Default>). |
Note: "Sort by" popup menu allows you to sort profiles by name or by creation time. "Columns" popup menu allows the changing of the number of columns (1,2 or 3) for the list of profiles.
To change the color for the selected palette, click mouse on an element that you want to change color for. Use right-click on an element to change its background color, and left-click to change the text color.
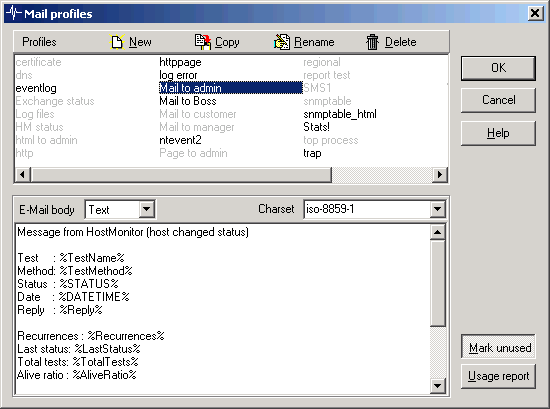
| Mail templates |
Multiple message templates can be created for the e-mail,
pager and ICQ notification. For instance, you can
set up HostMonitor to send general server status emails to the manager, and fire off an elaborate problem report to
the administrator in case of a network failure.
Macro variables are supported in message templates to be substituted with their actual
values at the message generation time. This way you may use single template for thousands of test items.
If template is used for "Send e-mail" action, you may use special directive like
<<IncludeFile=path_to_the_file>> (e.g. <<IncludeFile=c:\HostMonitor\template1.htm>>
or <<IncludeFile=%CommentLine3%>>).
When HostMonitor detects such directive, it
inserts content of the file into mail and then resolves macro variables (it
means you may use macro variables in external file as well).
Note: normally size of the file should not exceed 48K however you may tell HostMonitor to include just top of the file, from line 1
to line N. E.g. if you add EMailIncludeNLines=15 line into [Misc] section of hostmon.ini file, then
HostMonitor will include up to 15 lines from top of the file into e-mail body (maximum 256 lines).
For each mail template you may choose content type: Text or HTML.
If you choose HTML, HostMonitor will resolve test related macro variables
according to HTML encoding rules. For example test name "<local comp>" will be translated to "<local comp>".
User defined variables and folder related variables are substituted as is.
This allows you to use folder comments and user defined macro variables to store certain elements of HTML code (can be used
as styles).
Also you can specify a particular character set for your templates. This
comes in especially handy if you work in a multilingual environment.
To manipulate with templates use 4 buttons:
| New | Create new template. |
| Copy | Copy selected template. This is useful if you want to make small modifications for the existing template. |
| Rename | Change name of the template. You can rename mail templates without having to worry that the program will lost the link to the template; HostMonitor uses internal IDs that are unique and non-changeable throughout the lifetime of an object. |
| Delete | Remove selected template. |
| Usage report | Such reports tell you which action profiles use selected mail template. |
| Mark unused | With this option enabled templates that are not used by any action profile will be displayed in grey color. |
Note: "Sort by" popup menu allows you to sort profiles by name or by creation time. "Columns" popup menu allows the changing of the number of columns (1,2 or 3) for the list of profiles.
| Report manager |
HostMonitor can generate reports at regular intervals and/or when some tests change their status. It is also worth
noting that each folder may contain its own list of reports, and each of the
reports can be set up with a launching schedule specific to that folder. Also reports can be generated at user
request at any time through the Reports menu in HostMonitor's main window.
Reports can be in either HTML, DBF, WML, or Text formats. With reports, you can easily check the status of your
network from anywhere using a Web browser or your WAP cell phone. Example
For more information how to use reports please, refer to "Logs&Reports" section of
this documetation.
The highly flexible Report Manager allows you to create and customize reports to your preferences in a variety of ways.
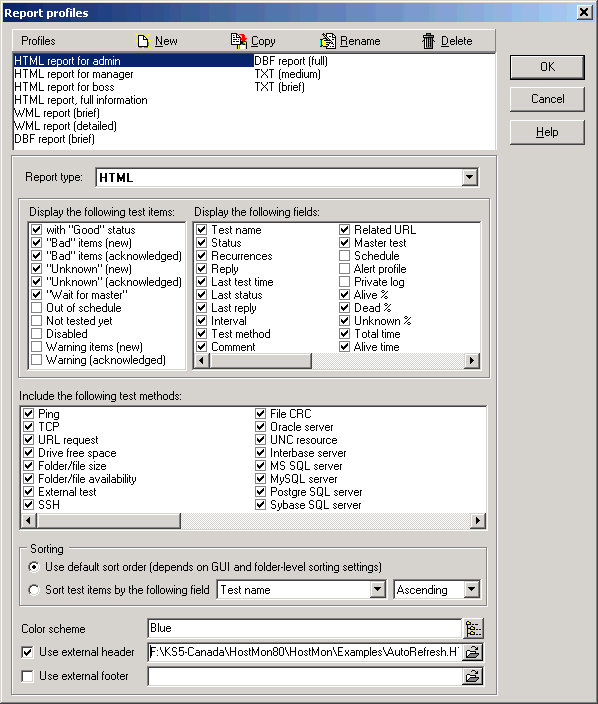
The configurable report parameters include:
Report type
Choose one of the available report types:
| - HTML | - | HTML file format. Test items will be represented in the table, each test item will be recorded as one row in the table. Example |
| - WML | - | WML (Wireless Markup Language) file format |
| - DBF | - | DBF (Data Base File) format |
| - Text | - | Text file |
| - Dashboard | - | HTML file format. Every folder is represented by a row in the table. Each cell of the row represents tests of a certain type from within that folder (e.g. Ping, CPU Load, Service, Drive Free Space). Example1, Example2 |
| - Compact HTML | - | HTML file format. Each test will be represented by small button. You may click on those buttons in order to retrieve detailed information about the test. Example (faiures rate), Example (reply), Example (average reply), Example (block), Example (by folder) |
| - Custom HTML | - | HTML file format. HostMonitor will use HTML templates provided by you to create report. Example1, Example2 |
| - SLA | - | SLA reports in HTML or XML format |
All reports have some common properties:
Test method filter
"Include the following test methods" list allows you to select the test types that should be included in the report (e. g., you may select all test methods except Ping and CPU Usage tests). Click the mouse button on the check box next to a field name to mark/unmark the item. Use "Mark all" popup menu item to select all available fields, use "Clear all" popup menu item to deselect all items.
To exclude some specific test items from the report use "Exclude from reports" test property.
Sorting mode
You may setup HostMonitor to sort test items in the report in the same way it sorts test items on screen (this option is selected by default). So, test items will be sorted in the order specified on Columns page in the Options dialog, unless the folder overrides global options and uses its own sorting mode (e.g. different folders may use the same set of report profiles but different sort orders).
Or you may directly specify sort method for the report profile. In such case test items will be sorted by specified field regradless of global and folder-level options.
The following properties are applicable for any report except DBF, WML and Text reports:
Color scheme
Choose a color scheme that you like from a drop down list, or use
External Header
Specify an HTML file that will be used as a header for the report. You need to specify this option only if you want to change the standard header of the report. In HostMonitor's directory "Examples\" you can find several samples of the external header:
| File | Type of the report example was made for | Purpose |
| StdHeader.html | HTML | this external header is similar to the one that HostMonitor is using, can be used as a base for the creation of your own headers. |
| Summary.html HTML | HTML | external header with tests' statuses summary. |
| AutoRefresh.html | HTML | file contains command to auto refresh HTML page. Your browser will be refreshing the page's contents at regular intervals (by default 60 seconds, but you can change the interval). |
| CompactHeader.html | Compact HTML | this external header is similar to the one that HostMonitor is using for Compact HTML reports, can be used as a base for the creation of your own headers. |
| dbHeader.html | Dashboard | this external header is similar to the one that HostMonitor is using for Dashboard reports, can be used as a base for the creation of your own headers. |
External footer
Specify an HTML file that will be used as a footer for the report. You need to specify this option only if you want to change the standard footer of the report. HostMonitor's directory "Examples\" contains 2 samples of the footer:
- StdFooter.html - this external footer is similar to the one that HostMonitor is using, can be used as a base for creating your own footers.
- Summary2.html - contains external footer with tests' statuses summary.
To manipulate with profiles use 4 buttons:
| New | Create new report profile. |
| Copy | Copy selected profile. This is useful if you want to make small modifications for the existing profile. |
| Rename | Change profile's name. You can rename profiles without having to worry that the program will loose the link to the profile; HostMonitor uses internal IDs that are unique and non-changeable throughout the lifetime of an object. |
| Delete | Remove selected profile. |
| Popup menu items provide access to additional options: | |
| Sort by | Option allows you to sort profiles by name, report type or creation time. |
| Columns | Use this option to change the number of columns (1,2 or 3) for the list of profiles. |
| Usage report | This option shows usage report for selected profile. Such report tells you what folders (within loaded HML file) use selected report profile. |
| Mark unused | With this option enabled profiles that are not used by any folder (within current HML file) will be displayed in grey color. Note: this option does not check if report profile is used by some external HM Scripts |
Other reports have some unique properties.
"Simple" HTML, WML, DBF, TXT reports
These reports show simple list of tests (table) and test properties. You may define the following properties for each report:
Status filter
Use left listbox to select the status set. To create the report HostMonitor will use tests with the selected statuses
only (e. g., include tests with a "No answer" or "Unknown" status only). Click mouse button on the check box next to
a field name to mark/unmark the item. Use "Mark all" popup menu item to select all available fields, use "Clear all"
popup menu item to deselect all items.
To exclude some specific test items from the report use "Exclude from reports" test
property.
Fields list
The right listbox in the Report Profiles dialog contains list of fields that you can include in the report (e. g.,
test name, status, average response time, downtime, comment, related URL, etc.). Click mouse button on the check box
next to a field name to mark/unmark the item. Use "Mark all" popup menu item to select all available fields, use
"Clear all" popup menu item to deselect all items.
You can change fields order in the report by dragging items with a mouse (click left mouse button on the item and drag
it to a new place). Also you can change the name of the field, using Columns page
in the User Preferences dialog (use <Default> profile for such operation!).
Dashboard reports
Dashboard is actually an indicator panel. One glance at the dashboard will give you comprehensive overview of all
tests in all folders (example).
Every folder is represented by a row on the dashboard. Each cell of the row represents tests of a certain type from
within that folder (e.g. Ping, CPU Load, Service, Drive Free Space). Number inside cell and their color depend on
the tests results:
| Color* | Meaning of the color of the cell | Meaning of the number in the cell |
| N | Some test(s) have "bad" status (non-acknowledged) | Number of "bad" test items |
| N | No "bad" tests but some test(s) have "warning" status (non-acknowledged) | Number of "warning" test items |
| N | No "bad" or "warning" tests but some test(s) have "unknown" status (non-acknowledged) | Number of "unknown" test items |
| N | There are some "bad", "warning" or "unknown" items, all of them acknowledged | Number of acknowledged tests |
| N | No "bad"/"unknown" tests but there are "WaitForMaster" test item(s) | Number of tests with "Wait.." status |
| N | ALL tests are disabled | Number of disabled tests |
| N | All tests have "OutOfSchedule" status | Number of "OutOfSchedule" tests |
| N | No "bad"/"unknown"/"WaitForMaster" items, some (all) tests are "good" | Number of "good" test items |
| 0 | No tests of this type in the folder | 0 - no tests |
Click on the cell to see the list of tests of specific method (Ping, Process, etc) that have "bad", "unknown", or "WaitForMaster" status (from the specific folder of course). Report may display up to 10 test items of each status. E.g. if you click on "red" cell that represents Ping tests for "USA Office" folder, you will see "bad" (as well as "unknown" and "waitformaster", if any) ping tests within that folder.
Dashboard report has a few more parameters (than regular HTML report):
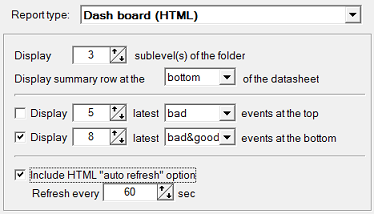
Display N sublevel(s) of the folder
This parameter defines how many sublevels of the folder tree will be displayed.
For example if you create report for the root folder with "Display 2 sublevel(s) of the folder" option, HostMonitor will create a table that displays tests of the root folder, it's direct descendants (1st sublevel) and descendants of root descendants (2nd sublevel). If the folder tree contains more levels of subfolders, information about test items from deeper subfolders will be included in the last displayed level of subfolders.
Display summary row at the top/bottom of the datasheet
Choose where the summary row will be displayed.
Display N latest "bad" / "good" / "bad&good" / "any" events at the top
Display N latest "bad" / "good" / "bad&good" / "any" events at the bottom
These optional settings allow placing information about latest events of specified kind at the top and/or at the bottom of the report. You may choose what kind of events will be displayed. E.g. "bad" event records provide information about failed tests; "good" events provide information about recovered items, and so on.
The term "event" means a log record that was added with every test status change. If logging mode for some test is set to "Reply" or "Full", HostMonitor adds new record when either the test status or "Reply" field value the test changes.
Include "AutoRefresh" option
With this option enabled HostMonitor will include into report command for HTML browser to refresh HTML page every N sec.
If you want to create a customized external header for Dashboard report, please note:
- HTML header must contain list of styles for the table header, folder items and for each possible test status
<style type="text/css">
td.Header1 { ..style definition.. }
td.Header { ..style definition.. }
td.Folder { ..style definition.. }
td.NotTested { ..style definition.. }
td.Ok { ..style definition.. }
td.Bad { ..style definition.. }
td.ClassWarn { ..style definition.. }
td.Unknown { ..style definition.. }
td.ClassACK { ..style definition.. }
td.Disabled { ..style definition.. }
td.WaitForMaster { ..style definition.. }
td.OutOfSchedule { ..style definition.. }
td.NoTests { ..style definition.. }
</style> - Header should contain "showinfo" function, this function is called every time when user clicks on a cell. It shows the list of test items. E.g.
<script language="JavaScript"> <!--
function showinfo(info) { alert(info); }
--> </script>
Compact HTML Reports
Compact HTML report useful when you monitor hundreds or thousands of servers. Each test in the report will be represented by rectangle element.
Compact HTML Report has a few more parameters:
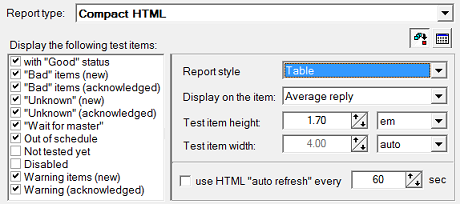
Report style
Choose one of the following options:
| - Table | Example #1 | Note: report header may show name, status and reply value of the current element (element near mouse pointer).
You may click on any element in order to check detailed information about the test; you may close popup window
with details using ESC key or click on Ok button or click on window header |
| - Group tests by folders. | Example #2 | |
| - All tests in one block. | Example #3 |
Display on each item
Select what information HM should display on each button. You can select any field (like "Test name", "Status", "Reply", "Comment", etc), or choose "<nothing>" to display items without any text.
Size of test item
Specify width and height of the elements using standard CSS units (px, pt, in, em, ch, etc) or set auto mode, in this case size of the elements will depend on content
Include "AutoRefresh" option
With this option enabled report will include command for web browser to refresh the page every N sec.
Fields button
Set list of fields displayed by popup window (this window displayed when you click on the element), e.g. test name, status, reply value, previous status, schedule, alert profile, comments and much more. You can re-order fields by dragging and dropping items
If you plan to create external header for Compact HTML report, please note:
- header must contains list of styles for the folder items and each possible test status
<style type="text/css">
input.Folder { ...style definition... }
input.NotTested { ...style definition... }
input.Alive { ...style definition... }
input.Ok {...style definition... }
input.NoAnswer { ...style definition... }
input.Bad {...style definition... }
input.BadContents {...style definition... }
input.Warning { ..style definition.. }
input.Unknown { ...style definition... }
input.UnknownHost { ...style definition... }
input.Checking { ...style definition... }
input.Resolving {...style definition... }
input.ACK {...style definition... }
input.Disabled {...style definition... }
input.WaitForMaster {...style definition... }
input.OutOfSchedule {...style definition... }
</style> - in order to display detailed test information header should contain 2 functions:
"showHint" called when the mouse pointer is moved onto an element
"showInfo" called every time user clicks on an element
Custom HTML Reports
Custom HTML report is the most flexible report type. However it needs more time from you to configure the report profile.
HTML and Compact HTML reports allow you to change header and footer of the reports, custom HTML report allows you to
change everything. Define your own HTML template using special macro variables and HostMonitor will generate HTML report
using parameters of the tests and folders instead of macro variables.
Each section (header, summary, gap, etc) allows you to use following macro variables:
- Regular macro varaibles (the same varaibles those used for external header/footer for regular HTML report);
- User defined variables
- Date & time variables
Header
Specify header of the report, this template will be used once for the report.
Folder title
Provide HTML code that will be used to display Folders. Here you may use Folder Specific macro variables (in addition to regular, user defined and date variables).
If you do not want to display folders in the report, leave "Folder title" field empty.
Test items
Provide HTML code for each test status. Here you may use test related macro variables (in addition to regular, user defined and date variables).
Folder summary
Provide HTML code that will be used to display summary information about each Folder. Here you may use Folder Specific macro variables (in addition to regular, user defined and date variables).
If you do not want to display any summary information, keep "Folder summary" field empty.
Gap between folders
Provide HTML code that will be inserted between last test item (from current folder) and next folder. In other words this code will be used before each folder item except 1st one.
Footer
Specify footer of the report, this template will be used once for the report.
SLA reports
When "Store historical data in the file" option (located in "Test list properties" dialog) is enabled,
HostMonitor collects additional statistical information for each test item. Such information can be displayed
by SLA reports, "Test history" window, Web Service interface, etc.
You may setup HostMonitor to generate SLA reports using XML or HTML file formats. HTML SLA report can be created in forms of text table or list of charts.
Examples:
- Table report 1
- Table report 2
- Performance charts
- Availability charts
- Availability prediction
SLA report profiles provide additional properties:
Mode
Select file type for the report: XML or HTML
Chart
When you setup HTML SLA report, you may setup report without charts or choose one of several types of charts:
- Availability
- Performance
- Availability + average reply
Folder summary
With this option enabled HostMonitor will calculate average alive/dead ratio and average reply values for each folder
included into the report; folder summary information is based on each test item within the folder.
Show folder comment
With this option enabled HostMonitor will display comments assigned to each folder included into the report. You may
specify number of specific line of the comment (as folder comment is multy-line text).
Show test comment
With this option enabled HostMonitor will display comments assigned to each test item included into the report. You
may specify number of specific line of the comment (as test item comment is multy-line text).
Include disabled items
This option tells HostMonitor to include or exclude currently disabled items into the report
Consider items as bad when
HostMonitor may mark report items (tests, folders and summary items) as "bad item" using color specified for "bad" items
by selected color palette. With this option enabled you may specify when item should be considered as "bad" item. You
may select one of the following parameters to be checked and compared with the number (e.g. "max reply > than 1000"
or "average reply < 20"):
- "dead" ratio
- "alive" ratio
- min reply
- max reply
- average reply
Display statistics for
Each SLA report (each file) may include set of "sub-reports" - information regarding specific period of time:
|
- Prediction: next 7 days - Today - Yesterday - Last 24 hours - Last 48 hours - This week |
- Last week - Last 7 days - Last 14 days - This month - Last month - Last 30 days |
- Last 60 days - This year - Last year - Last 12 months - Last 24 months |
"Prediction: next 7 days" mode tells HostMonitor to calculate and show statistical counters for future 7 days. HostMonitor analyzes previous 30 days of test results trying to predict future test results. HostMonitor shows counters (textual information) for next 7 days while charts show data for last 7 days and next 7 days (using different color for past and the future). Of course software cannot tell you what really happens in the future, its just assumption based on historical data.
Important note: If you have a lot of test items, we would recommend to generate HTML SLA reports with charts using built-in Scheduler (e.g. start "Generate reports" action once a day). We do not recommend using "Generate reports" action (for reports with charts) in action profile assigned to some frequently performed test items. That's because generation of thousand charts can take significant time.
Macros
"Regular" macro variables
Below is a list of the macro variables those can be used in an external header/footer for the HTML, Compact HTML, and Custom HTML reports:
| Variable | Description |
| %Date% | current date |
| %Time% | current time |
| %DateTime% | current date & time |
| %TimeZone% | time zone information (note: you may specify different regional settings on per-folder basis) |
| %BGColor% | background color |
| %TextColor% | text color |
| %LinkColor% | hypertext link color |
| %VLinkColor% | visited link color |
| %ALinkColor% | active link color |
| %TotalTests% | number of tests in the report |
| %GoodTests% | number of tests with "Good" status |
| %BadTests% | number of tests with "Bad" status |
| %UnknownTests% | number of tests with "Unknown" status |
| %WarningTests% | number of tests with "Warning" status |
| %AckBadTests% | number of "Bad" acknowledged test items |
| %AckUnknTests% | number of "Unknown" acknowledged test items |
| %AckWarningTests% | number of "Warning" acknowledged test items |
| %DisabledTests% | number of disabled tests |
| %WaitForMasterTests% | number of tests with "Wait for master" status |
| %OutOfScheduleTests% | number of tests with "Out of schedule" status |
"Folder specific" macro variables
Below is a list of the macro variables those can be used in "Folder title" and "Folder summary" sections of the Custom HTML report:
| Variable | Description |
| %Folder% | Represents the name of the folder |
| %FullPath% | Displays full path to the folder (like Root\Main Office\Web server) |
| %FolderAverage_AliveTime% | The average value of the AliveTime counter over all test items within the folder. AliveTime counter represents overall time the test has had a "Good" status |
| %FolderAverage_DeadTime% | The average value of the DeadTime counter over all test items within the folder. DeadTime counter represents overall time the test has had a "Bad" status |
| %FolderAverage_UnknownTime% | The average value of the UnknownTime counter over all test items within the folder. UnknownTime counter represents overall time the test has had a "Unknown" status |
| %FolderAverage_AliveRatio% | The average ratio AliveTime to TotalTime, in percent (over all test items within the folder) |
| %FolderAverage_DeadRatio% | The average ratio DeadTime to TotalTime, in percent (over all test items within the folder) |
| %FolderAverage_UnknownRatio% | The average ratio UnknownTime to TotalTime, in percent (over all test items within the folder) |
| %FolderAverage_PassedTests% | The average number of passed probes over all test items within the folder |
| %FolderAverage_FailedTests% | The average number of failed probes over all test items within the folder |
| %FolderAverage_UnknownTests% | The average number of probes finished with "Unknown" status, over all test items within the folder |
| %FolderMin_MinReply% | The minimum value of the results obtained (over all test items within the folder) |
| %FolderMax_MaxReply% | The maximum value of the results obtained (over all test items within the folder) |
| %FolderAverage_AverageReply% | The average value of the results obtained (over all test items within the folder) |
| %FolderAverage_MinReply% | The average value of the MinReply counter over all test items within the folder. MinReply counter represents the minimum value of the results obtained by test item. |
| %FolderAverage_MaxReply% | The average value of the MaxReply counter over all test items within the folder. MaxReply counter represents the maximum value of the results obtained by test item. |
| %FolderTotal_PassedTests% | Total number of passed probes for all test items in the folder |
| %FolderTotal_FailedTests% | Total number of failed probes for all test items in the folder |
| %FolderTotal_UnknownTests% | Total number of probes finished with "Unknown" status, for all test items in the folder |
| %FolderTotal_SummarizedReply% | Aggregate total of Reply field value for all test items in the folder |
| %FolderCurrent_TotalTests% | Number of the test items in the folder (not counting tests those you have decided do not include into the report, e.g. disabled tests) |
| %FolderCurrent_GoodTests% | Number of the test items (in the folder) those have "Good" status at the report generation time |
| %FolderCurrent_BadTests% | Number of the test items (in the folder) those have "Bad" status at the report generation time |
| %FolderCurrent_UnknownTests% | Number of the test items (in the folder) those have "Unknown" status at the report generation time |
| %FolderCurrent_WarningTests% | Number of the test items (in the folder) those have "Warning" status at the report generation time |
| %FolderCurrent_AcknowledgedBad% | Number of "Bad" acknowledged test items in the folder |
| %FolderCurrent_AcknowledgedUnknown% | Number of "Unknown" acknowledged test items in the folder |
| %FolderCurrent_AcknowledgedWarning% | Number of "Warning" acknowledged test items in the folder |
Also in any section (header, footer, test items, etc) of the Custom HTML report you can use 2 contents specific macro variables:
| Variable | Description |
| %ItemColor% | text color |
| %Background% | background color |
| Connection Manager & Password Generator |
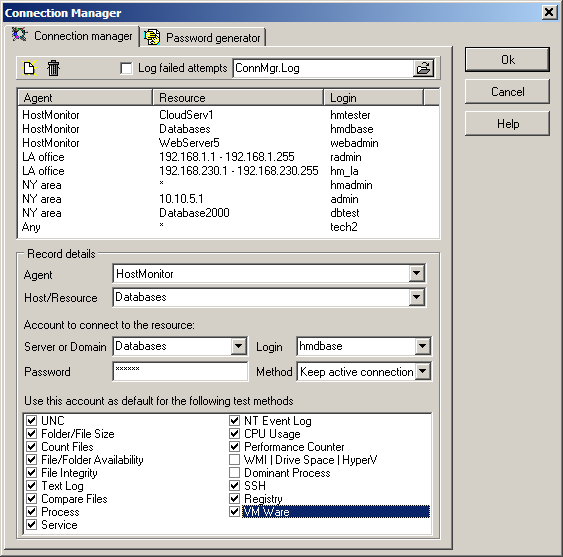
Connection Manager
 When you check the remote system, some test methods (like CPU Usage, Process, Service, NT Event Log and several
others) need to establish connection with that remote system using a user name and password. Connection Manager
provides one convenient place to store account information necessary to perform connections to remote systems.
When you check the remote system, some test methods (like CPU Usage, Process, Service, NT Event Log and several
others) need to establish connection with that remote system using a user name and password. Connection Manager
provides one convenient place to store account information necessary to perform connections to remote systems.
As you already have noticed, many tests have "Connect as" option that allows you to provide an account name and
password necessary to establish communication. But if, for example, you need to check 20 different processes on
the same server, you will need to specify that password for every test separately. With the help of Connection
Manager you only need to create a single record for the account. This is also very convenient when the password
for that account is changed from time to time (check also Password Generator).
Another advantage of Connection Manager - it allows you to provide account information for test methods that
normally were designed to work with local files but may also be used to test remote shares as well. Test
methods Folder/File Size, Count Files, File Availability, File Integrity, Text Log, and Compare Files do
not have "Connect as" option. However when the path to the file/folder is specified in UNC format, Connection
Manager may establish connection prior to the execution of these tests.
Also you may specify "Reconnect if necessary" option for an account. With this option selected when the system
(where HostMonitor is running) is already connected to the remote system with a user account that doesn't have
enough permissions to perform the test, Connection Manager may reconnect the system using specified account.
And one more advantage: if HostMonitor is unable to establish connection with the remote system, Connection Manager
may log the response from that remote system; information such as why the connection was rejected will be stored.
So, what information you need to provide for each record:
Agent
Use this field to specify Remote Monitoring Agent (or HostMonitor) that will check target host or LAN.
If you set "Any" option, then account can be used for any agent and HostMonitor itself.
Please see notes below
Host/resource
Specifies an UNC path to the resource with which HostMonitor are going to establish the connection. E.g. if you
plan to use an account for CPU Usage, Process or Service test methods that require a connection to the remote
system, you may use just the name of target system (like \\primaryserver). Or you may specify a full path to
the share (e.g. \\primaryserver\web\sharefolder1), this makes more sense for file related tests such as Folder
Size or File Integrity.
Server or Domain
Specifies the DNS or NetBIOS name of a remote server or domain that will authorize connection.
Login
Provides a user name that is used for the connection.
Password
Specifies a password to be used when establishing the network connection.
Method
This parameter defines HostMonitor's behavior in case when the connection with specified remote system is already established but with different (than specified) account.
Choose one of the options:
- Keep active connection
- Reconnect if necessary
With 2nd option selected, Connection Manager will drop current connection and establish new one using specified account.
Use this account as default for the following test methods (list of test methods)
Here you select test methods that will use specified account as default. "Default" means that this account will be used unless another account is specified directly for the test item (using "Connect as" option).
Special accounts:
-
You may provide "default" account that will be used by HostMonitor for every resource not
included in the list. To do so, type * as resource name. Then you may provide name of the server/domain or
type * instead of server name. In 1st case HostMonitor will send authentication information to the specified
server; in 2nd case (unc=* and sever=*) HostMonitor will connect to the server that was specified as test
parameter.
- In addition to default and host-specific accounts, you may specify accounts based on IP address ranges
(e.g. you may specify one user account for 10.10.1.5-10.10.1.55 range, another account for 10.10.1.200-10.10.1.235 range)
- Note: Connection Manager may use account specified for some specific IP or IP range even if you are using
hostname (not IP) for the test item target. When HostMonitor tries to find account for target server, it checks records trying to find
specified resource or hostname; if such resource/hostname not found, HostMonitor resolves hostname to IP address and check Connection
Manager records for this IP. If account for specific IP address could not be found either, HostMonitor will try to find appropriate
account within "IP range" accounts. Only when all attempts fail, HostMonitor will use "default" account.
Some restrictions apply:
- HostMonitor itself should be able to resolve hostname; it will not use Remote Monitoring Agents for this operation;
- some "hostname to IP" conversions related to UNC resources is not supported. E.g. if you setup file related test method using target resource like \\hostname\resource\folder\file and you have specified one or several accounts using IP or \\IP or IP range, this will work fine. But if you specified only one Connection Manager account using \\IP\resource path (e.g. \\192.168.1.100\C$), then HostMonitor will not use this record for connection (even if "hostname" can be resolved to "192.168.1.100" IP).
Step 1
- 1-a) highest priority has record for specific agent and specific resource. E.g. If "Folder Size" test performed by "NY-agent" checks \\dbase_server5\tables\root\ folder, then HostMonitor will try to find account record with enabled "Folder/File size" test method for NY-agent with resource field set to \\dbase_server5\tables\root
- 1-b) if such record not found, then HostMonitor checks for account record with the same properties but with agent field set to "Any" (any RMA or HostMonitor)
Not found? go to Step 2
- 2-a) HostMonitor will try to find account record with enabled "Folder/File size" test method for NY-agent with resource field related to target host (e.g. \\dbase_server5\tables or dbase_server5 will match)
- 2-b) if such record not found, then HostMonitor checks for account record with the same properties but with agent field set to "Any"
No such records? go to Step 3
- 3-a) HostMonitor will use IP address of target system to check for appropriate record (resource for specific IP or IP range) specified for "NY-agent"
- 3-b) if such record not found, then HostMonitor checks for specific IP or IP range specified for "Any"
If there is no record for target host, go to Step 4
- 4-a) Get "default" account (resource specified as *) for "NY-agent"
- 4-b) Finally (lowest priority), use "default" account specified for "Any"
So, now we have 8 priority levels.
Note: If you provide some account just for primary agent and primary RMA agent fails and there is backup agent installed, same account will be used.
LAPS
The Local Administrator Password Solution (LAPS) provides management of local account passwords of domain joined computers. Passwords are stored in Active Directory (AD) and protected by ACL. Connection Manager may retrieve up to date local administrator passwords from Active Directory and update records in HostMonitor database.
By default "administrator" account name is used; if you set LAPS for other account (using LAPS GPO policy), change account name on HostMonitor side as well using Connection Manager popup menu LAPS -> Set default account name.
You may update password for single selected item using menu LAPS -> Update password for selected item.
You may update passwords for all items using menu LAPS -> Update passwords for ALL administrator accounts (please check Note1 and Note2).
Note 1: Remote Monitoring Agents do not support LAPS options yet. So Connection Manager may update records related to hosts within local HostMonitor/RCC domain.
Note 2: domain/server field of the record should point to specific server, default account (*) and accounts for IP ranges are not updated.
Note 3: Microsoft LAPS modules should be installed on system where HostMonitor (and/or RCC) is running
https://www.microsoft.com/en-us/download/details.aspx?id=46899
Note 4: in order to get passwords using LAPS HostMonitor/RCC account requires "All extended rights" permission. Please make sure regular users, groups or computer objects do not own this permission. To restrict the ability to view the password to specific users and groups you need to remove "All extended rights" from users and groups that are not allowed reading the value of attribute ms-Mcs-AdmPwd. This is important because the "All Extended rights" permission gives permission to read confidential attributes.
We can redesign Connection Manager, HostMonitor and Remote Monitoring Agents will work with LAPS more efficiently and you will need to create just one record for entire LAN. Do you use LAPS? Do you needs such options? Please contact us (e-mail to support@ks-soft.net). Priority of this task depends on feedback from you.
Other options
- Export to CSV file
- Import from CSV file
- "Find" and "Search again" popup menu items (Ctrl+F, F3). Application may check for IP address within IP range, e.g. it may find "10.10.5.55" in records like "10.10.5.11-10.10.5.99"
Password Generator
 Another page in the same dialog represents Password Generator utility. This utility allows you to generate new
passwords for the set of accounts with a single click.
Another page in the same dialog represents Password Generator utility. This utility allows you to generate new
passwords for the set of accounts with a single click.Note: domain admin rights requires.
Every time you change records in Connection Manager utility (add new record, modify or remove existing one) these changes are automatically applied in Password Generator utility (as you add new record in Connection Manager, you will see that new record appears in Password Generator utility as well).
To generate new passwords follow these steps:
- Mark accounts for which you want to change passwords (if you already have used Password Generator some time ago, it will remember the list of marked accounts and you may skip this step). If you want to mark multiple accounts, hold the Shift key while selecting the first and the last items to select a range of records and then press Space to mark/unmark selected records.
- Specify the length of passwords. Password Generator will generate random passwords (of specified length) using upper and lower case letter characters 'A'..'Z'; 'a'..'z', and numbers '0'..'9'
- Optionally you may mark "Log results into" selector and provide a file name that will be used for the log.
- Also you may use "Display passwords" option. In this case Password Generator will display new passwords for each account.
- Click "Generate new passwords" button
When Password Generator connects to the server and successfully changes a password, it also changes the password for the account that was specified in Connection Manager utility. This way, all accounts will be synchronized.
However it will not change passwords for test items that use "Connect As" option.
IMPORTANT: When you click "Generate new passwords" button you should remember that:
- All changes that were made in Connection Manager utility will be saved
- You will not be able to restore old passwords automatically (THERE IS NO UNDO)!
- If selected accounts are in use by some users (or another applications), they will not be able to use these accounts after new passwords will be generated!