RCI is a feature of the monitor that allows you to check and control HostMonitor remotely (using web browser or telnet client). RCI uses TCP/IP protocol and needs just one TCP port (by default this is a port #1054). You can setup different parameters of the interface (like port number, timeout, limit for the number of simultaneous connections, etc) on RCI page in the Options dialog.
For each user account you can specify a list of IP addresses from which a connection can be accepted and a list of operations (such as start/stop of monitoring, enable/disable tests, etc) that are allowed for the user.
To control HostMonitor through RCI you have to install either Web Service and/or Telnet Service. These applications can be installed on the same system where HostMonitor is already installed or on any other (remote) system that can communicate with HostMonitor's system via TCP/IP protocol.
Web Service application will allow you to use web browser (such as Internet Explorer) to control HostMonitor. Telnet Service application allows you to use any telnet client to check HostMonitor.
Also you may use Remote Control Console (RCC). RCC allows you to work with HostMonitor which is running on a remote system just like you work with HostMonitor when it is started on your local system. RCC has exactly same interface as the one of the HostMonitor.
| RCI Status window |
To bring up this window use menu "View"->"RCI Status". There you may check the status of Remote Control Interface. The list of remote operators that are currently connected to the HostMonitor and the recent list of commands being send to HostMonitor are also available in this window. With the buttons in the right panel of the window you may change the RCI settings, manage user's accounts, send message to any RCC operator and disconnect RCC clients.
Active remote operators
In the upper part of the window there is a list of remote operators that are currently connected to the HostMonitor. Using the button "Disconnect" (in the right panel) you may disconnect selected remote operator. The button "User profiles" brings up the User Profiles dialog, where you may manage the access permissions for each of the remote operators (users). You may add new user accounts, disable or enable existing accounts, etc.
Latest commands
In the lower part of the window there is a list of the latest connections and commands that were executed by remote operators.
Status bar
The status line shows statistical information: the number of active remote connections, the number of connections that were accepted and rejected since the HostMonitor was last started.
Note:
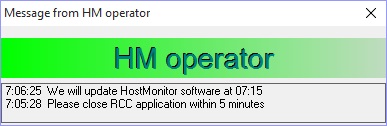
When RCC client receives text message from another operator, it shows "green" popup window. Operator may close this window or keep window on screen and continue working with test items and profiles as usually.
When admin selects some RCC client and clicks "Disconnect" button for the first time, RCC client will not be disconnected immediately. HostMonitor will mark this client as "disconnecting" while RCC operator will see "red" popup window with countdown timer and "I need more time" button. Operator may click (once or several times) on "I need more time" button and reset timer to 60 sec. Otherwise client will be disconnected in 15 seconds.
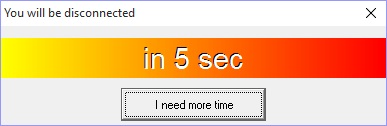
When admin clicks "Disconnect" button 2nd time (for the same RCC client), RCC will be disconnected immediately.
User
This menu of HostMonitor's main window accommodates the set of tools related to user profiles and accounts management in HostMonitor:
- GUI Preferences - allows you to setup various GUI options on per-user basis.
- Custom menu profiles - allows you to create custom menu items.
- Operators - user profiles manager. Allows you to create new users accounts, delete existing user's accounts and manage their rights and permissions.
- Login as - here you may log in as another user without interrupting the HostMonitor. For example when you have to perform an operation that requires Administrators privileges
- Change password - if "change its own RCC password" permission granted, RCC allows operator to change its own password
| Operators |
 Since the version 4 HostMonitor supports different permissions for each user.
Each user (operator) has an account with a name, full name and a password.
According to the set of permissions users may perform some (or all) of the following operations:
Since the version 4 HostMonitor supports different permissions for each user.
Each user (operator) has an account with a name, full name and a password.
According to the set of permissions users may perform some (or all) of the following operations:
- add tests/folders
- configure tests/folders
- remove tests/folders
- disable/enable tests
- reset statistics
- start/stop monitoring
- change options
- manage schedules
- manage mail profiles
- manage color profiles
- manage report profiles
- manage action profiles
- manage user profiles
- acknowledge test status
- pause/resume test items
- edit GUI options for the account
- edit GUI options for ALL accounts
- view test setting (read-only)
- manage shell scripts
- use Connection Manager
- change its own RCC password
- backup/restore operations
Also you can specify a list of IP addresses authorized for remote connections for each of the accounts.
Please note:
- to insert new address press INSERT button; to remove item press CTRL+DEL;
- you may specify ranges of IP addresses from which a connection may be accepted. E.g. 192.168.1.1 - 192.168.1.100;
- you may use '0.0.0.0' IP address. If you specify 0.0.0.0 address, HostMonitor will accept incoming connections from ANY address.
Status
Here you can temporarily disable account or set authentication options by choosing one of the following options:
- account disabled
- HM authentication
- HM or Windown authentication
HM authentication
This authentication mode can be used by any application (Web Service, Telnet Service, WatchDog, Remote Control Console) started on any system - workgroup or domain member, Windows or Linux. E.g. HostMonitor authentication mode used when you login to HostMonitor thru Web Service using web browser started on Linux system.
Windows authentication
Windows authentication can be used when you connect to HostMonitor using RCC (Remote Control Console) and both Windows systems (HostMonitor system and RCC system) are domain members. In such case remote RCC operator may choose "Windows authentication" option and connect to HostMonitor without providing username/password.
Note: in order to use Windows authentication mode while HostMonitor running as service you should set user account for the service using Windows "Services" applet (do not set user account using HostMonitor Options dialog).
Windows account on HostMonitor side can be specified as domain\username or just username (in case of single domain). E.g. if operator logged in to Windows system and started RCC under "DOMAIN1\manager123" name, then either "DOMAIN1\manager123" or "manager123" operator account should be created on HostMonitor side.
Limit number of RCC connections for the account to N connection(s)
This option allows you to limit number of simultaneous RCC connections on per-user basis. E.g. you may allow "admin" to use 1 connection only and allow "guest" account to use up to 5 RCC connections. If you set limit to 0, user will be able to use Web Service and Telnet service but will not be able to use RCC
Home folder
Since the version 6 HostMonitor provides a "home folder" option that can be specified for each operator. If you do so, the operator(s) will see test items within their own specified folder (and its subfolders) only. In this way, you may easily separate work/permissions between departments of a company.
For each account (operator) you may choose one of the following options
- All folders in any HML list
- The following folder only <folder name>
- No access to this HML list
If you are using several test lists, you may assign different home folders for each operator. For example: operator "US_Manager" may have access to all folders (Root\) within "USA.HML" file and access to single folder "Root\Public\" within "Canada.HML" file.
| Note 1: | "Home folder" option has effect for any operator that works with monitor remotely using Remote Control Console, Web Service or Telnet Service. An operator that works with HostMonitor's GUI on a local system will have access to the entire test list as in previous versions. |
| Note 2: | Using Remote Control Console to edit test properties (list of master tests), it is possible to see 'ID <number>' instead of the name of the master test (Test Properties dialog). This means that the master test is located in a folder to which the operator does not have access. If you need information about this master test, it can be provided by an operator with a higher level of rights. |
| Note 3: | HostMonitor uses GUID to identify HML files and a unique FolderID to identify a user's home folder. This means if you copy or rename the file, rename or move the home folder, HostMonitor still knows what home folder is assigned for each user. However, if you use menu "File"->"Save as", HostMonitor will assign new GUID to new HML file. In this case, it may be necessary to reassign the home folder for the operators except when they have access to all/root folder. |
Special accounts
There are 3 special accounts: "Admin", "Local" and "Watchdog".
"Admin" and "Local" accounts cannot be deleted or disabled (however you can change the list of allowed operations for these accounts). An "Admin" account always has permission to manage other user's accounts. The "Local" account has no password and no permissions for remote connections. The "Local" account may be used only by a staff that has direct access to the system on which HostMonitor is installed. It is also used by HostMonitor at startup. To log in as another user go to the menu "User"->"Login as".
"Watchdog" account can be used for remote connections established by WatchDog application. This account does not have any rights to manage test list or profiles. You cannot remove this account however you can disable it. Also you may specify a list of IP addresses authorized for remote connections.
To setup and configure users accounts use the menu "User"->"Operators".
| Login As |
When HostMonitor starts it always uses the special built in user account - "Local". If you want to perform operation(s) that are not permitted for the "Local" user go to this menu item where you may log in as another user at any time. The dialog will ask you to provide a username and a password.
The same dialog appears every time when the user tries to perform an operation that is not permitted for him. In this case within the Login dialog you will have three options:
- If you do not have the rights and permission to perform the desired operation then your only choice is the "Cancel" button. Contact your system administrator to acquire the rights for that operation later.
- Log in as another user. Select an account and enter the password if you know it. If you chose «normal login» mode then you will stay logged under the selected account until you or another user will select another account or until the HostMonitor will be restarted.
- In "Temporary" login mode you will gain the rights and permissions of the selected user only for the single operation. As soon as you finish the desired operation, (for example if you wanted to change a test property then "finish" means the test properties dialog is closed) HostMonitor will roll back to the previous user account.
| Custom menu profiles |
This dialog is accessible from the menu "User"->"Custom menu profiles". This feature allows you to create custom menu items. These menus will appear after right clicking on the test in the Test Details area of HostMonitor window. For each menu item you have to provide a name, a command line and a window mode parameter (Hide, Normal, Maximized, etc). You may specify a list of users that will be able to execute this menu item and a list of test methods that will inherit this menu.
Note: "Sort by" popup menu allows you to sort profiles by name, command line or creation time.
In the name and in the command line of custom menu item you may use macro variables. Depending on the test which you will right click, HostMonitor will use current values of variables. E.g. you can define the command line to send a message to administrator such as "NET SEND admin %TestName% %Status% %Reply%". Another example - you may define a name of the menu item as "%CommentLine7%", HostMonitor will use 7th comment line of the selected test as a name of the menu. If the 7th comment line is empty, then this menu item will not appear. This feature is useful when it is necessary to apply a custom menu command only for some specific tests. If you want to limit the use of a menu item by tests from some specific folders, then you should use folder related macro variables (%FolderComment% or %FCommentLineX%) as a name of the item (or in a command line).
Also you may use %OperatorName% variable - name of the logged in operator.
If command starts with [copy] keyword then HostMonitor does not execute command, instead it resolves variables and copies data into clipboard. E.g. if you set menu item using the following command line [Copy] Test: %TestName%<cr>Reply: %Reply% select the test and click on menu, then HostMonitor will copy into clipboard buffer string with test name and reply value (note: <cr> resolves to CRLF characters).
| User Preferences |
User Preferences dialog allows you to setup various GUI options on per-user basis.
Yes, HostMonitor allows you to setup different color profiles, list of test properties to display, sorting mode, etc for some specific folder(s) of the test list. "Per-folder" level settings may be useful when each operator has its own home folder or you want to distinguish some folder among rest of tests.
While User Preferences dialog allows you to use different GUI settings even if several users have access to the same folder (e.g. "admin", "manager 1", "manager 2" and "boss" accounts may have access to Root' folder (entire test list) but they want to use different color scheme and display different list of test properties).
In other words, you may setup unique color palette and other GUI related options for each operator plus you may set specific color palette for some folder(s) as well. These folder-level settings will be used for all user account.
User Preferences dialog allows you to copy settings between accounts and setup <Default> account. Settings of <Default> account will be applied for each new user account, then admin or user may change its own settings. Note: you may change name of fields using <Default> account only; new name will be applied for all account.
Use menu "User" -> "GUI preferences" to open this dialog.
There are 2 permissions can be specified for each operator:
- edit GUI options for the account
With this option enabled operator may change GUI options for its own account only. If operator works with HostMonitor remotely using RCC, settings specified in User Preferences dialog will be stored in the profile on HostMonitor system. This allows operator to move between different remote systems, login to HostMonitor and use the same settings on any remote system. When user changes column sizes, RCC sends this information to HostMonitor as well.
- edit GUI options for ALL accounts
If operator with such permission opens User Preferences dialog, he will see list of user profiles and he will be able to change settings for any profile (including <Default> profile), copy settings from one profile to another and so on.
- if operator does not have any of these rights, he cannot change GUI options using HostMonitor. He can change settings using RCC, however these changes will not be stored. Next RCC session will use settings specified for this account by admin (or another operator with necessary rights). This is useful when you want to use the same account for many operators (e.g. guest account).
| Interface |
Grouped on the Interface page are the general look and feel options that apply to the program, its main window and built-in utilities.
Style
Define how tests are displayed in the Test Detail Area:
- Report - table view, one test per line as a small icon followed by detailed test information
- List - top-down view, a small icon with a test name;
- Icon - tests arranged left to right, a large icon with a test name;
- Small icon - tests arranged left to right, a small icon with a test name;
Color scheme
Chose a color scheme to be used for the main window, log viewer and utilities. Select one of the pre-defined or create a new scheme by pressing the button to the right of the Scheme Name box.
See Color profiles for more information on colors.
Show grid lines
If the option is enabled, HostMonitor will display gridlines to separate task items in the main window.
Show tests in subfolders (recursive)
If the option is disabled, displayed in the Test Detail Area will be tests contained directly in the currently selected folder. If the option is enabled, all tests contained in the current folder and in all of its descending subfolders will appear in the Test Detail Area.
| IP-Monitor |
Options for the IP-Monitor utility: refresh time, chart colors, number of grid lines.
| Columns |
Use the Columns page to select columns (test parameters) to display in the Test Detail Area. To select/deselect a column, toggle the check mark next to it. To change a column's display order, highlight the column and then use the Up
The Sort by list defines the order in which tests will be arranged. To add a column to the sort order, highlight a column in the left-hand list and then click the Right
Note 1: GUI allows you to change sorting "temporarily" by clicking on any column title. You may click the same column title twice to change sorting order.
Note 2: You may use custom fields for "temporary" sorting only (you cannot set custom field as default field for sorting)
To change the display name of a column, highlight the column and click the little button
Here is a list of test parameters supported by HostMonitor with a brief description of each parameter.
| Column name | Field description |
| Test name | The name of the test |
| Test method | The type of the test |
| Test by | Name of the remote agent that performs the test. Field displays "HostMonitor" when the test is performed by HostMonitor |
| Comment | Any arbitrary comments |
| Related URL | Test-related URL |
| Master test | The name of the Master test (for more information on test dependencies see Common test properties) |
| Interval | The time between two consecutive runs defined for the test |
| Schedule | The name of the associated schedule |
| Alert profile | Alert profile name |
| Private log | The specified private log file name |
| Created at | The time when the test was created |
| Modified at | The time when the test was last modified |
| Status | The current status of the test |
| Recurrences | The number of consecutive tests resulting in the same status as the current one |
| Reply | The value last returned by the test (the meaning of the Reply parameter is test specific) |
| Last test time | The time when the test was last performed |
| Last status | The status of the previous test |
| Last reply | The value returned by the previous test (test-specific) |
| Acknowledged at | The date and time when test status was acknowledged |
| Acknowledged by | Name of the operator who have acknowledged the test status |
| ACK comment | Shows the comment which was provided for "acknowledge" operation |
In addition to the static test parameters (test name, interval, status, etc.), and current status related (status, reply, etc.) a number of dynamic statistics data fields are maintained and can be viewed (and reset) in real time.
| Column name | Field description |
| Alive % | "Good" to overall tests ratio, in percent |
| Dead % | "Bad" to overall tests ratio, in percent |
| Unknown % | "Unknown" to overall tests ratio, in percent |
| Total time | The time the test has been in monitoring |
| Alive time | The overall time the test has had a "Good" status |
| Dead time | The overall time the test has had a "Bad" status |
| Unknown time | The overall time the test has had an "Unknown" status |
| Total tests | Overall tests performed |
| Passed tests | The number of "Good" tests |
| Failed tests | The number of "Bad" tests |
| Unknown result tests | The number of "Unknown" tests |
| Average reply | The average value of the results obtained |
| Min reply | The minimum value of the results obtained |
| Max reply | The maximum value of the results obtained |
| Status changed at | The time when the status last changed |
| Status changes count | The number of times the status has changed |
Custom fields
Also you may add up to 8 custom fields for each account. You can use most of test related variables to define field value and any static text to describe the field (you cannot use "historical" variables like %Stat24Hours_MinReply%, %Stat30Days_AliveRatio% and SNMP related variables). You may use one or several variables in each field and static text but you cannot use expressions like %TestID% + %FailureID% (here + will be considered as static text, not mathematical operator, in other words HostMonitor will display value of these two variables, not sum of the values).
For example you may create FolderA for file related test items and tell HostMonitor to display filename, file size and modification time for each test item; another FolderB may contain URL test items and display HTTP response code as additional field.
Note: you may add custom fields for Folders and Views as well.