| Local Info |
Examines the local host and displays information about the local computer: processor, memory, Winsock data, etc
Some comments regarding counters that show memory status:
Total Physical
The amount of actual physical memory installed on the system.
Avail Physical
The amount of physical memory currently available. This is the amount of physical memory that can be immediately reused without having to write its contents to disk first.
Total Page File
The current size of the committed memory limit. This is physical memory plus the size of the page file, minus a small overhead.
Avail Page File
The maximum amount of memory the HostMonitor can commit.
Total Virtual
The size of the user-mode portion of the virtual address space of the HostMonitor process.
Avail Virtual
The amount of unreserved and uncommitted memory currently in the user-mode portion of the virtual address space of the HostMonitor process.
| Trace |
Traces the route to a remote host over the network. This utility allows you to see the route all packets take to go from your machine to a specific host on the Internet (Intranel, LAN). It also displays the time each hop (or each machine packets go through) takes to answer. You can specify the parameters to trace (such as the packet size, timeout, packets to send, TTL, and the maximum number of hops) on the Ping/Trace page in the Options dialog.
When you specify trace target you should provide the domain name (e. g. www.yahoo.com) or IP address (e. g. 204.71.200.68) of the host. Also you may provide IPv6 addresses (e.g. fe80::370:ff56:fed5:22) and specify hostname with suffixes ::ipv4 or ::ipv6 (e.g. www.google.com::ipv4 or www.6bone.net::ipv6).
If you specify hostname without any suffix, HostMonitor will try to resolve name into IP address using IPv4 protocol. If name cannot be resolved by IPv4 protocol, HostMonitor will try to use IPv6 protocol. If you specify hostname with ::ipv4 (or ::ipv6) suffix, HostMonitor will use IPv4 (or IPv6) protocol only.
Note: HostMonitor supports IPv6 on Windows XP SP2, Windows 2003, Windows Vista and Windows Server 2008 when IPv6 protocol is installed. On Windows NT 4.0 and Windows 2000 only IPv4 is supported. You may use menu Tools -> Local Info to check is your system IPv6 ready.
How Trace works?
The program determines the route taken to a destination by sending Internet Control Message Protocol (ICMP) echo packets with varying TTL (Time-To-Live) values to the destination. Each router along the path is required to decrement the TTL on a packet by at least 1 before forwarding it, so the TTL is effectively a hop count. When the TTL on a packet reaches 0, the router is supposed to send back an ICMP Time Exceeded message to the source system. Trace determines the route by sending the first echo packet with a TTL of 1 and incrementing the TTL by 1 on each subsequent transmission until the target responds or the maximum TTL is reached. The route is determined by examining the ICMP Time Exceeded messages sent back by intermediate routers. Notice that some routers silently drop packets with expired time-to-live (TTL) and are invisible to trace.
| Telnet |
Telnet client is a terminal emulation program for TCP/IP networks such as the Internet, which allows you to logon to the computer from a remote location. You can then enter commands through the Telnet program and the commands will be executed as if you were entering them directly on the server console. This enables you to control the server and communicate with other servers on the network.
This utility has two windows. The lower window doesn't translate ESC sequences but stores all received data and works similar to the log file. The upper window uses the telnet client's virtual terminal that translates ESC sequences.
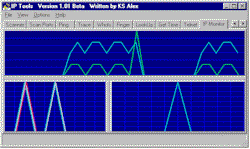
| IP Monitor |
The IP-Monitor displays, in real time, graphics for counting In, Out and Error packets for TCP, UDP, and ICMP protocols.

- TCP In
-
The total number of segments received, including those received in error.
This count includes segments received on currently established connections.
- TCP Out
- The total number of segments sent, including those on current connections
but excluding those containing only retransmitted octets.
- UDP In
- The total number of UDP datagrams delivered to UDP users.
- UDP Out
- The total number of UDP datagrams sent from this entity.
- UDP Error
- The total number of received UDP datagrams for which there was no
application at the destination port. +
The number of received UDP datagrams that could not be delivered for
reasons other than the lack of an application at the destination port.
- ICMP In
- The total number of ICMP messages which the entity received
(this counter includes all those counted by icmpInErrors).
- ICMP Out
- The total number of ICMP messages which this entity attempted to send
(this counter includes all those counted by icmpOutErrors).
- ICMP Error
-
The number of ICMP messages which the entity received but determined as
having errors (bad ICMP checksums, bad length, etc.).
+
The number of ICMP messages which this entity did not send due to
problems discovered within ICMP such as a lack of buffers. This value
should not include errors discovered outside the ICMP layer such as the
inability of IP to route the resultant datagram. In some
implementations there may be no types of error, which contribute to this
counter's value.
| IP-Tools |
Also, we offer separate application IP-Tools, a feature-rich suite integrating 19 helpful TCP/IP utilities. Please check out how IP-Tools can help you in diagnosing network problems on a LAN or WAN, detecting trojan programs on your computer, gathering information from network devices, and a lot more.