HostMonitor can log application events to a log file(s) or database. Different log detail levels and log file formats can be configured to suit your needs. There are 4 kinds of logs:
Common log
Common log is a file or database that is shared by all test items defined in the working test list. All
events that are subject to logging (according to test's configuration) get recorded in the common log.
You may specify Primary and Backup common logs. For each log you may choose defferent log type
(ODBC or File),
file format (HTML, Text
or DBF) and logging mode (Full, Brief, Midnight or Reply).
E.g. you may use Full logging mode for primary ODBC log managed by your SQL server and use Brief logging
mode for backup HTML log stored on local hard drive.
HostMonitor can switch from primary to backup log when necessary or use both logs at the same time. Also
HostMonitor may execute specified alert profiles when primary or backup logs are
not accessible.
All aspects of the common log's behavior are controlled through Options dialog:
- Log settings
- Log processing
Private log
Additionally, for each test you can define its own, "private" log file. The type of a private log is determined based on the file extension: HTML for .htm*, DBF for .dbf, plain text for any other extension.
Private logs can be configured to work in one of the following modes:
- Default - the common settings defined in the Options dialog are used;
- Brief - record information whenever status of the test changes;
- Full - record all test results, regardless of whether their status had changed or not;
- Reply - record information into log every time the status or reply value of the test changes.
If a private log is specified, the popup menu for that test will contain the item, "View private log".
Custom logs
In some cases you may need very specific logging option, like "if temperature in server room between 70 and 75 degrees F, record every test probe; othewise log nothing". In such case you may disable common and private logs for the test item and use "Record HM log" or "SQL Query" actions to save information.
System log
System log is yet another log type. HostMonitor uses the system log to record events like start/stop monitoring, as well as information on started and/or failed alert actions. You may setup log parameters on the System log page in the Options dialog.
User operations log
Also HostMonitor may record operations performed by local or remote operators, operations performed by HM Script or HostMonitor itself. It records information about enabled and disabled test items, paused and refreshed items, removed folders and tests, modified folders, views and tests, started scripts, import operations and so on. Each type of operation has its own ID. List of such operations listed in the manual (see Appendix #2).
For each operation HostMonitor records:
- Event time
- Operator type (HostMonitor, local operator, remote operator, HM Script, import procedure)
- Unique ID of the operator and operator's name (for local and remote operators)
- Operation ID and operation name (XML log file contains operation ID only)
- Item ID (usually this is test ID or folder ID, e.g. if you move test item, this field will show test ID)
- Result (Done, Rejected or Failed)
- Description (may contain test name, folder name, some comments)
Log setting located on System log page in HostMonitor Options dialog.
Log processing
Log processing options allow you to manage log files: e.g. you may setup HostMonitor to remove files older than 3 months, or you may configure HostMonitor to keep just 2 log files - for previous and current month.
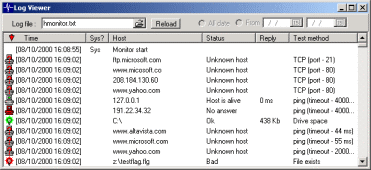
 To view log files, you can use either the built-in viewer, associated programs or an external program. You can setup different viewers to view different log types. For example,
to view an HTML log file you can use the associated program (your default web browser); to view a text log file you can use the build-in log viewer, etc.
See Options -> Log Viewers.
With the built-in log viewer, you can view any of the supported log types (HTML, Text, DBF). The viewer supports sorting, which allows you to order log records by any field (time, test name, status, reply value, etc).
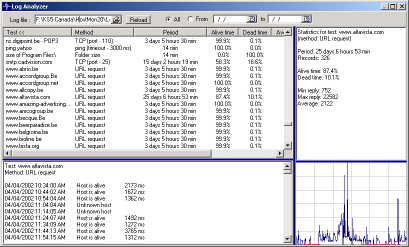
 Advanced Host Monitor package includes Log Analyzer. Log Analyzer is a graphical tool
that visualizes the log data. It parses the contents of a log file and presents the data as a variety of charts
representing different test statistics. Log Analyzer may analyze all types of log files: HTML, Text, and DBF log files.
In a second, administrator can get a snap shot of the host performance over a period of days or even months.
Several examples of the reports that were generated by Log analyzer:
Example #1
Example #2
Example #3
HostMonitor can generate reports at regular intervals and/or when some tests
change their status. Reports can be in either HTML, DBF, WML, or Text formats.
The highly flexible Report Manager allows you
to create and customize reports to your liking in a variety of ways. Also note that
each folder may contain its own list of reports, and each of the reports can be set up with a launching schedule specific to that folder.
With reports, you can easily check the status of your network from anywhere using a Web browser or your WAP cell phone.
Examples:
HTML Report,
Dashboard,
Compact-Block,
Compact-Table,
Custom Report1,
Custom Report2.
DBF report useful for analyzing (after generating reports HostMonitor can launch an external program for analyzing or other purposes).
A list of up to 6 global reports (reports that apply to all tests in the working HML file) can be defined
on the Reports page in the Options dialog.
Additionally, each folder may have its own list of reports; only the tests contained in the folder will be used in generating these folder-specific reports.
There are two more parameters that can be specified for both global and folder-specific reports:
- time interval - tells HostMonitor how often reports should be generated
- external program to execute - if specified, HostMonitor will launch the external program after reports have been generated.
It is also possible to have HostMonitor generate a report every time a test changes its status.
This can be done by adding "Generate reports" action to the Action Profile.
The other way to implement the same behavior would be to add a "Run HMS Script" action, and include a CreateReport command in the script to execute.
Also note that reports can be generated at user request at any time through the Reports menu in HostMonitor's main window.
When you provide the name of the common, private or
system log file or setup target files for the
reports you can use special macro variables in the file name:
| %d% | - | Current day as a number without a leading zero (1-31). |
| %dd% | - | Current day as a number with a leading zero (01-31). |
| %ddd% | - | Current day as an abbreviation (Sun-Sat) using system's regional settings. |
| %dddd% | - | Current day as a full name (Sunday-Saturday) using system's regional settings. |
| %ddddd% | - | Current date using the short date format (see Windows Regional Options). |
| %dddddd% | - | Current date using the long date format. |
| %ww% | - | Current week as a number with a leading zero (01-54). |
| %m% | - | Current month as a number without a leading zero (1-12). |
| %mm% | - | Current month as a number with a leading zero (01-12). |
| %mmm% | - | Current month as an abbreviation (Jan-Dec) using system's regional settings. |
| %mmmm% | - | Current month as a full name (January-December) using system's regional settings. |
| %yy% | - | Current year as a two-digit number (00-99). |
| %yyyy% | - | Current year as a four-digit number (0000-9999). |
| %/% | - | Displays the date separator character given by the DateSeparator system variable. |
Examples:
c:\HostMonitor\Logs\%DDMMYYYY%.DBF
c:\HostMonitor\Reports\%mm-dd-yy%.html
c:\HostMonitor\%YYYY%log\%mm%.html