HostMonitor provides different ways to respond to failed services. Audio and visual notifications
can alert people near the machine. E-mail and pager notifications can be used to inform a wider range of remote
operators. Some of the actions HostMonitor can take will try to recover from a failure automatically without
human intervention.
Each test can be set up with an individual action profile, and each action profile may contain a number of alert
actions that can be launched in a predefined order depending on the test results. Action can be launched by
HostMonitor or by RMA.
Here is a list of available actions to kick off in response to a problem:
Note: in most cases single alert profile is enough for test item because each alert profile may contain several actions with different starting conditions, different time restriction options; also you may use "advanced mode" actions.
However in some cases you may reduce number of necessary alert profiles by using 2 alert profiles per test item. If you enable "Allow 2nd alert profile for test items" option (located on Preferences page in HostMonitor Options dialog), you will be able to assign 1 or 2 alert profiles for each test item.
To work with action profiles you can use the Action Profiles dialog. To bring up this dialog use menu
Profiles->Action profiles in HostMonitor's main window or appropriate buttons
in the Test Properties dialogs.

In the upper part of the dialog you can see a list of Action Profiles and buttons (New, Copy, Rename, Delete) that
allow you to modify this list. Each of the Action Profile has 2 sets of actions: «Bad»
actions and «Good» actions. The sets of actions and buttons for modifying these actions
(Add/Edit/Del) you can find in the lower part of the dialog.
You have to understand difference between actions profile and actions: each test has link to one (only one) of the
action profiles, and each of the action profiles may contain a number of actions that can be launched in a
predefined order depending on the test results.
Assume action profile has been assigned to the test. In this case every time after test is done and log file was
updated HostMonitor performs actions that are assigned in the related list: it uses list of "Good" actions if test
has "Good" status, and uses list of "Bad" actions if test has "Bad"
status. To determine which actions from the list should be executed and which should not, HostMonitor uses 3
properties that each "standard" action has:
- Start when [N] consecutive Bad/Good results occur - this parameter determines when to execute the action
- Repeat - defines the number of repeats of the action if the status of the test was not changed
- Time restriction - defines time restriction for an action execution
For example you want to monitor some important service. In case the service does not respond you want to send an e-mail message to the network administrator and restart the service. If that does not help, "Reboot remote system" action must be executed. If the functionality of the services restored, you want to send a message about this happy event to the administrator. To implement this behavior, create an action profile with four actions (3 "Bad" actions and 1 "Good" action):
- "Bad" action: send e-mail
Condition to start action: standard mode
Start when: 1 consecutive "bad" result occur
Retries: 1
- "Bad" action: restart service
Condition to start action: standard mode
Start when: 1 consecutive "bad" result occur
Retries: 1 - "Bad" action: remote reboot
Condition to start action: standard mode
Start when: 2 consecutive "bad" results occur
Retries: 1 - "Good" action: send e-mail
Condition to start action: standard mode
Start when: 1 consecutive "good" result occur
Retries: 1
If you do not specify an action profile for a test, HostMonitor will simply perform check and write down a record
to the log file (if the logging is enabled). Also you can disable action profiles execution for all tests, to do
so mark "Disable alert reactions" option on Behavior page in the
Options dialog.
|
Note: In the HostMonitor terminology, "Bad" status means one of the following: - "No answer"; - "Bad"; - "Bad contents". "Warning" test items considered as "bad" if "Treat Warning as Bad" option is enabled. Also for a test with the option "Tread Unknown status as Bad" the following statuses considered as bad: - "Unknown host" - "Unknown" Similarly, "Good" status means either: - "Host is alive" - "Ok" |
You can modify existing demo profiles or create any number of your own profiles.
| To manipulate with the list of profiles use 4 buttons above listbox with profiles list: | |
| Create new profile |
| Copy selected profile. This command is convenient if you want to use an existing profile and just slightly change it. |
| Change profile's name. You can rename profiles without having to worry that the program will loose the link to an action profile; HostMonitor uses internal IDs that are unique and non-changeable throughout the lifetime of an object. |
| Remove selected profile |
| Popup menu items provide access to additional options: | |
| Option allows you to sort profiles by name or creation time. |
| Use this option to change the number of columns (1,2 or 3) for the list of profiles. |
| This option shows usage report for selected profile. It tells you where profile is used (test items, HostMonitor scheduler, folders, logging alerts, etc). |
| If you enable this option, profiles that are not currently in use will be displayed in grey color. |
| To modify each action profile use buttons located on bottom line of the dialog: | |
| Allow you to add new action into profile |
| Bring up Action Properties dialog for editing parameters of the selected action |
| Remove selected action |
Move up / Move down
When several actions have the same start condition (e.g. start after 2nd consecutive bad result) these popup menu items allow moving actions up and down in the list within the same action profile.
Note: for most actions with the same starting condition changing starting order does not make any difference because HostMonitor executes such actions simultaneously. However for the following actions this makes sense because HostMonitor does not start other actions until one of these actions completed:
- Generate reports
- SQL Query
- Run HM Script
For example, you may setup alert profile that will generate report files and send reports using "Send E-Mail" action.
Copy as good/bad action
This popup menu item allows you to copy actions from "bad" to "good" and from "good" to "bad" sections of the same action profile.
When you need to change action parameters on regular basis, you may use user defined variables. However in
some cases you cannot predict necessary changes, e.g. you need to change path to some external application because you moved
HostMonitor to different system. In this case Find&Replace option can save your time.
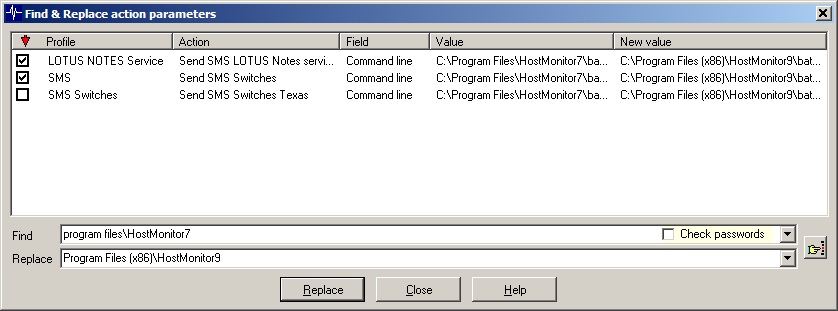
Click "Find&Replace" button to open "Find&Replace" dialog window. Then provide search string and the replacement string. To replace
the text with nothing, leave 2nd input box blank. Optionally you may mark "Check passwords" field.
Note: HostMonitor checks for possible result strings and does not allow you to make replacement for an item if entire action
parameter will be empty after replacement (there are some exceptions: password fields; final packet of "Send data to TCP/UDP port"
actions and SNMP Set Value).
When you click "Find" button, HostMonitor will scan action profiles checking for the search string within the following fields:
| Action | Parameters |
| Any "advanced mode" action | Condition to start |
| Hangouts chat | Webhook URL Message text |
| Microsoft Teams | Webhook URL Message text |
| Telegram message | Token Chat ID Text |
| Slack message | Webhook URL Title Message text |
| Viber message | Token Receiver Text |
| Play sound | Path to the file |
| Send message to pager (TAP) | Access number Pager ID Password* |
| Send message to pager (SNPP) | Pager ID Target server Login Password* |
| Send message to beeper | Beeper number Message Termination string |
| Send SMS (GSM) | Destination phone number |
| Send SMS (SMPP/IP) | Destination phone number |
| Send e-mail (SMTP) | Sender Recipient Subject Path to attachment |
| Send message to ICQ | ICQ # (UIN) |
| Send message to Jabber | Jabber account |
| Record HM Log | Destination file name |
| Stop/Start/Restart service | Computer name Service name User name Password* |
| Remote reboot | Computer name Message to display |
| Dial-up to the network | Connection name Username Password* |
| Disconnect dial-up connection | Connection name |
| Execute external program | Command line Working directory |
| Start program remotely | Target host Command line Working directory Username Password* |
| Kill process | Target host Process name Process ID Username Password* |
| Log Event | Computer name Event log Event source Event description Login Password* |
| SQL Query | ODBC data source name Login Password* SQL Query |
| HTTP request | Host name HTTP request |
| Send data to TCP/UDP port | Target server Init packet Final packet |
| Syslog | Target server Message |
| SNMP Set | Agent address Community string OID Value |
| SNMP Trap | Destination address Agent address Community string Enterprise MIB OID |
| Execute HMS script | Path to the HMS script file |
Search is case insensitive. E.g. if you search for "admin" then actions with strings "ADMIN@domain.com", "Admin555", "333adminhost" will pass thru filter.
*Note: HostMonitor may check and replace passwords used in some action profiles when "Check passwords" option is enabled. But "password search" algorithm is different:
- search for passwords is case SENSITIVE;
- password specified for the action must EXACTLY match the search string (e.g. if you specify "SaTF" search string, password "SaTF5" will not be replaced.
Find&Replace window will display list of action profiles, actions and parameters that contain the search string. Also you will see current value of the field and proposed new value (for each item). If the search string detected within several parameters of the action, or several actions within profile contain the search string, you will see several items in the list.
You may sort items by action profile name, action name, field name, current field value or proposed field value. You may mark all or some items and then use "Replace" button to perform replacement operation. This allows you to make replacement for some specific actions or specific fields. E.g. you may replace "admin@" with "manager@" in "recipient" field but keep "admin@domain.com" in "sender" field.
If you made mistake and wish to cancel all changes, close "Find&Replace" dialog and click "Cancel" button in "Action Profiles" dialog.
Action properties are defined in the Action Properties dialog. Some properties are common across all action types.
However, each type of action has a set of parameters that are specific to the action type. Let's have a look at the
common properties first (these parameters located in the upper half of the Action Properties dialog):
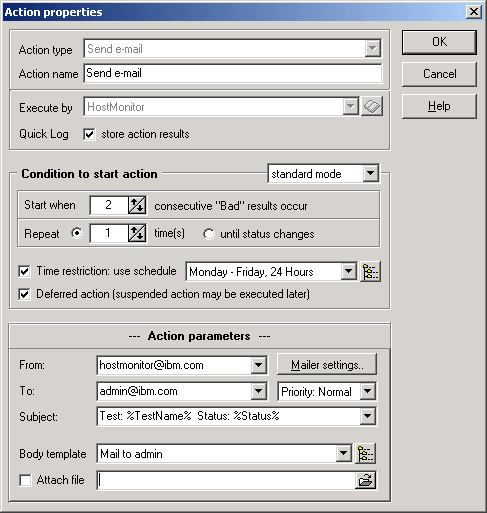
Action name
The name of the action; HostMonitor auto populates this field with a suggested name based on the type of action;
you can change that name to whatever name you want.
Execute by
Actions can be performed by HostMonitor or by Remote Monitoring Agent (RMA).
"Execute by" option allows you to specify how and where action should be performed. You may select from the list one
of the items:
|
action will be executed by the same application that had performed the test (test that triggered alert reaction). |
| action will be executed by HostMonitor |
| action will be executed by specific agent. You may select an agent from
drop down list or click on a button (to the right of the field) to manage agent list. Note: if specified RMA was linked with backup RMA and test was performed by that backup agent then action will be executed by the same backup agent. |
Quick Log: store action results
This option allows you to disable "Quick Log" recording for non-important actions, like "Play sound" action. Note: this option does not effect "system log" processing; HostMonitor will record action results into system log file depending on options specified on System Log page in the Options dialog.
Condition to start action
There are 3 different types of starting condition:
standard mode
Standard actions are those actions that are performed by HostMonitor after a test had returned specified result for specified number of times. Following 3 parameters defines when action should be executed:
Start when N consecutive Bad/Good results occur
This parameter determines when to execute an action. For example you want to send a message to a network administrator's pager after three unsuccessful tests of the web server consecutively, set this parameter to 3. If you want to start action right after the test status was changed, set parameter to 1.
Repeat: N times; or until status changes
Defines the number of repeats of the action if the status of the test was not changed. For example if you want to send an e-mail to a network administrator only once when test status changes, set this parameter to 1. If you need to execute action every time when test failed, set this option to "until status changes".
Action depends on "bad" one
This optional parameter is available for "Good" actions only. You can set "Good" action dependable on a "Bad" action. Why do you need it? For example you defined "Bad" action to send an e-mail notification to the network administrator when test fails 3 times consecutively (start when 3 consecutive "Bad" results occur), also you defined «Good» action to send a notification when the test status changes to "Good". What will happen if test fails 1 or 2 times and after this it restores "Good" status? HostMonitor will not send a notification about failure (because test did not fail 3 times) but the program will send notification about restoring "Good" status. To avoid unnecessary "Good" action execution you can mark "Action depends on "bad" one" option and select "Bad" action. In this case HostMonitor will start "Good" action only if corresponding "Bad" action was executed.
Several examples:
Example 1: You want a fresh network stats report to be posted on your intranet web server every time the test finds the server to be up and running. This can be done simply by adding the following "Good" action to the action profile:
Action: Generate reports
Start when: 1 consecutive "good" result occur
Retries: until status changes
Example 2: When some critical service dies, you want the server to automatically reboot. If that does not help, an e-mail should be sent to the on-call technician. If, however, the server remains silent during the next three tests, the network administrator is to be paged until the server is brought back up. To implement this behavior, create an action profile with three "Bad" actions defined like these:- Action: remote reboot
Start when: 1 consecutive "bad" result occur
Retries: 1 - Action: send e-mail
Start when: 2 consecutive "bad" results occur
Retries: 1 - Action: send message to pager
Start when: 5 consecutive "bad" results occur
Retries: until status changes
- Action: remote reboot
advanced mode
Advanced mode allows you to use logical expression as a condition that triggers the alert action. An alert action is performed when a logical expression of a condition is true. In these expressions you can use:- numbers and strings (in quotes). Strings that contain a number plus one of the following unit specificators
[ms, Kb, Mb, Gb, %] are compared as numbers, so that '900 Kb'
is less than '9 Mb'
- macro variables related to the current test or to any other test;
- global macro variables;
- logical operators [and, or, xor, not, <, >, >=, <=, ==, <>];
- arithmetic operators [div, mod, +, -]
Note: the value of (x div y) is the value of x divided by y and then rounded in the direction of zero to the nearest integer; 'mod' operator returns the remainder obtained by dividing its operands (in other words, (x mod y) == x - (x div y) * y);div (integer division) mod (remainder) + (addition) - (subtraction)
- string operators
Example:in Expression "Substr" in "Str" searches for a sub string Substr in a string Str. Operator returns True when Str contains Substr; otherwise operator returns False getword expression like ("string" getword N) returns Nth word from text string counting from beginning endword expression like ("string" endword N) returns Nth word from text string counting from end of the string csvfield retrieves field from CSV (comma-separated values) string ('string' csvfield N returns field #N)
tsvfield retrieves field from TSV (tab-separated values) string, works similar to csvfield command ('string' tsvfield N returns field #N) gettagval finds specified XML tag, returns tag value the following operators useful when you need to parse multi-line text where lines separated by CR, LF or CRLF characters getlinewith checks for specified text, returns 1st matched line with this text getlinestarts returns 1st line that starts with specified text getlineends returns 1st line that ends with specified text ('40 10 50' getword 3) - returns '50' (third word) ('40 10 50' endword 3) - returns '40' (3rd word counting from the end of the string) ('<tagAA>value11</tagAA><tagBB>value22</tagBB>' gettagval 'tagBB') - returns 'value22'
- parentheses. In complex expressions, common rules of precedence determine the order in which operations are performed:
An operator with higher precedence is evaluated before an operator with lower precedence, while operators of equal precedence associate to the left. You can use parentheses to override precedence rules. An expression within parentheses is evaluated first and then its result is treated as a single operand.Operators Precedence not first (highest) div, mod second +, -, in third <, >, >=, <=, ==, <> fourth and, or, xor fifth (lowest)
Advanced mode is more complicated than standard but is very very flexible. Just several simple examples:- '%SimpleStatus%'<>'UP' - action will be executed every time the test is performed and status of the test is not "good";
- '%Status%'<>'%LastStatus%' - action will be executed every time the test status changes;
- ('%Status%'=='No answer') and ('%LastStatus%'=='Host is alive') - action will be executed when the test status changes from "Host is alive" to "No answer"
- ('%SimpleStatus%'=='DOWN') and (%Recurrences%==5) - action will be executed if the fifth attempt of a test in a row fails
- ('%SimpleStatus%'=='DOWN') and (%Recurrences% mod 3==1) - action will be executed after 1st, 4th, 7th, 10th, 13th, ... consecutive failed test
- ((%Reply%>200) and (%Reply%<800)) or ('%::Main Router::SimpleStatus%'=='DOWN') - action will be executed when "Reply" value of the test is between 200 and 800 or status of the "Main Router" test is "No answer" or "Bad".
Note: There are special buttons in Action Properties
dialog that allow you to bring up "Expression editor" window for convenient expression editing.
in Action Properties
dialog that allow you to bring up "Expression editor" window for convenient expression editing.
- numbers and strings (in quotes). Strings that contain a number plus one of the following unit specificators
[ms, Kb, Mb, Gb, %] are compared as numbers, so that '900 Kb'
is less than '9 Mb'
on the schedule
Unlike standard and advanced actions that are triggered by events related only to the tests, scheduled actions are conformable to the schedule. They also may be triggered by some "global" events (e.g. HostMonitor can start "scheduled" actions when user stops monitoring). There are several places where you can use scheduled actions:- The Scheduler itself - a tab in the Options dialog allows you to execute up to 5 alert profiles by a schedule. E.g. HostMonitor may execute one profile every 1 hour and execute another profile every Monday at 21:00;
- Reports page in the Options dialog: now HostMonitor can execute alert profile after reports were generated;
- Reports page in the Folder Properties dialog;
- Statistics page in the Folder Properties dialog: HostMonitor can execute alert profile before resetting the statistics;
- Pause dialog: HostMonitor can execute alert profiles every time user starts or stops monitoring or when the user enables/disables alerts.
Time restriction
Schedules can be applied to actions the same way they were used for tests.
With schedules, actions can be customized per time of the day. For instance, an action profile can be set up to
page both the IT manager and the network administrator during regular office hours, and to page the administrator
alone the rest of the time, while doing nothing else but writing to the log on weekends. To make this possible,
simply check the "Time restriction" option and select an appropriate schedule.
Deferred action
"Time restriction" option allows you to suppress action execution depending on time of the day and/or day of
the week. Additional "Deferred action" option tells HostMonitor to delay action execution if specified
schedule does not allow immediate execution of the action. HostMonitor will execute action at the beginning
of "allowed" time frame on condition that status of the test is identical to status that triggered alert
(see Note #3).
Note 1: If the same test triggers the same action several times within "restricted" time frame, HostMonitor
will execute action just once at the beginning of "allowed" time frame.
Note 2: When HostMonitor starts deferred (delayed) action, macro variables will be resolved with using of
current (up to date) test status, current date and time, current status of HostMonitor, etc.
Note 3: HostMonitor considers the following statuses as identical
- Bad, Bad contents, No answer
- Ok, Host is alive, Normal
- Unknown, Unknown host
Also "Warning" status can be considered as identical to "Bad" when "Treat Warning status as Bad" option of
the test item is enabled. The same is true for "Unknown" and "Unknown host" statuses when "Treat Unknown
status as Bad" option is enabled.
Macros: You may use special macro variables in a command line to execute an external program, in e-mail's
subject line, in the mail templates, etc. For more information, please, refer to Macros section
of this document.
Listed below is information about various action types supported by HostMonitor:
Executing this action, HostMonitor will display a popup window with information about state of the test. All
settings for this window (position, time to display, etc) may be setup on the "Msg Window"
page in the Options dialog.
See also common action parameters
This action designed to play a sound file (WAV, MID, etc). In addition to the common action parameters,
the «Play sound» action has the following options:
Sound file
Specify full path to the sound file or click small button on the right side and select file from the Open File dialog.
Show WakeUP window and play sound repeatedly
With this option enabled HostMonitor will display a popup window with information about the event and will play a
sound repeatedly until you click "Stop" button.
This action allows to send messages into Google Hangouts Chat.
In addition to the common action parameters, the «Hangouts chat» action has the following options:
Webhook URL
This parameter tells HostMonitor where it should to send data. How to create webhook URL: from the chat room menu (Google Hangouts Chat) select Configure Webhooks.
A dialog appears that lists any incoming webhooks already defined for the room. Click on Add Webhook, then fill in the name field and
optionally the avatar URL field, click Save, then copy the system-generated URL into HostMonitor action properties window.
Text
Provide text for the message.
Macro variables such as %TestName%, %Status%, %Reply%, %RelatedURL% are supported in this field (to be substituted with their actual values at the message generation time).
Also Hangouts Chat lets you add basic formatting to the message text, including bold, italic, and strikethrough. To format text, wrap it with the following symbols:
* *bold*
_ _italic_
~ ~Strikethrough~
` `Monospace`
``` ```Monospace block``` (three backquotes)
If you include a plain link URL in your message text, such as https://google.com/, then google.com will be used as the link text and automatically hyperlinked to https://google.com.
To provide alternate link text for your link, use the following syntax: <https://www.ks-soft.net/hostmon.eng/index.htm|link text>
Sends a message to Microsoft Teams channel.
In addition to the common action parameters, the «Microsoft Teams» action has the following options:
Webhook URL
HostMonitor 14.70+ supports "office" and "workflows" webhooks (older versions support only "office" webhooks).
Microsoft plans to disable "office" webhooks on August 15, 2024. While "workflows" mode requires interactive integration user account within Microsoft Teams with a premium Power Automate license.
How to create "office" Webhook URL:
in your Microsoft Teams app, choose More options (next to the channel name) and then choose Connectors.
Scroll through the list of Connectors to Incoming Webhook, and click Add. Enter a name for the webhook, upload an image to associate with data from HostMonitor, and choose Create.
Copy the webhook to the clipboard and paste into HostMonitor action properties window.
How to create "workflows" Webhook URL:
in your Microsoft Teams app, choose channel, select Workflows option, then select the workflow you want to setup (Template: Post to a channel when a webhook request is received) and click Add workflow.
You will get webhook URL, copy it to the clipboard and paste into HostMonitor action properties window.
Text
Provide text for the message.
Macro variables such as %TestName%, %Status%, %Reply%, %RelatedURL% are supported in this field
(to be substituted with their actual values at the message generation time).
Markdown formatting (for "office" webhooks only)
Microsoft Teams supports a subset of Markdown formatting tags. Mark this option to enable markdown formatting.
** **bold**
* *italic*
~~ ~~Strikethrough~~
` `Monospace`
> >Block quote
[HyperLink text](https://www.bing.com/)

Please note: support for text formatting varies by platform, e.g. Android application does not support strikethrough style;
unordered and unordered lists supported only by Windows version of Microsoft Teams application.
This action method sends a message to Telegram messenger chat or channel.
In addition to the common action parameters, the «Telegram message» action has the following options:
Token
The token is required to authorize the bot (HostMonitor) and send requests to the Bot API, token may look like 110201543:AAHdqTcvCH1vGWJxfSeofSAs0K5PALD
You may use BotFather to create new bot (using /newbot command)
and generate an authorization token. Note: bot's username must end in 'bot', e.g. 'hostmon_bot'.
See also BotFather commands
Chat ID
Provide unique identifier for the target chat or username of the target channel (in the format @channelusername).
Macro variables are supported in this field (to be substituted with their actual values at the message generation time).
Note1: In order to send messages to channel bot should be added into admins of the channel.
Note2: How to get Group Chat ID
1) Add the bot to the group: go to the group, click on group name, click on Add members, search for bot (e.g. @hostmon_bot), select the bot and click Add.
2) Send a dummy message to the bot, e.g. /my_id @hostmon_bot
3) Make HTTPS request using the following url: https://api.telegram.org/botXXX:YYYY/getUpdates (replace XXX:YYYY with bot token)
4) Check response, look for "chat":{"id":-zzzzzzzzzz,
Done: -zzzzzzzzzz is your chat id (with the negative sign).
Text
Provide text for the message.
Macro variables such as %TestName%, %Status%, %Reply%, %RelatedURL% are supported in this field
(to be substituted with their actual values at the message generation time).
Parse as (Text / Markdown / HTML)
Telegram Bot API supports basic formatting for messages. You can use bold and italic text, as well as inline links and pre-formatted code
in your messages. Telegram clients will render them accordingly. You can use either markdown-style or HTML-style formatting.
Markdown formatting
* *bold*
_ _italic_
~ ~Strikethrough~
` `inline fixed-width code`
``` ```pre-formatted fixed-width code block``` (three backquotes)
[inline URL](http://www.example.com/)
[inline mention of a user](tg://user?id=123456789)
Links tg://user?id=<user_id>can be used to mention a user by their id without using a username. Please note:
These mentions are only guaranteed to work if the user has contacted the bot in the past, has sent a callback query to the bot via inline button or is a member in the group where he was mentioned.
HTML formatting
<b>bold</b>
<i>italic</i>
<a href="http://www.example.com/">inline URL</a>
<a href="tg://user?id=123456789">inline mention of a user</a>
<code>inline fixed-width code</code>
<pre>pre-formatted fixed-width code block</pre>
Please note:
- Only the tags mentioned above are currently supported by Telegram.
- Tags must not be nested.
- All numerical HTML entities are supported.
- The API currently supports only the following named HTML entities: <, >, & and "
Silent
Mark this option to send the message silently - users will receive a notification with no sound.
Sends a message to Slack messenger channel.
In addition to the common action parameters, the «Slack message» action has the following options:
Webhook URL
You can create Slack app at https://api.slack.com/apps/new,
activate Incoming Webhooks, add New Webhook, pick a channel and authorize your Slack app. Than you can find Webhook URL in Slack app settings,
it should look like https://hooks.slack.com/services/T00000000/B00000000/XXXXXXXXXXXXXXXXXXXXXXXX
Title
Title of the message.
Macro variables such as %TestName%, %Status%, %Reply% are supported in this field
(to be substituted with their actual values at the message generation time).
Text
Provide text for the message.
Macro variables such as %TestName%, %Status%, %Reply%, %TaskComment%, %RelatedURL% are supported in this field
(to be substituted with their actual values at the message generation time).
Markdown formatting
With this option enabled you may use markdown formatting in your message:
* *bold*
_ _italic_
~ ~Strikethrough~
` `Monospace`
``` ```Monospace block``` (three backquotes)
The Slack supports several binary emoji formats, the list of emoji supported are taken from https://github.com/iamcal/emoji-data
This action allows to reach Viber messenger
users using Viber Public Account.
In addition to the common action parameters, the «Viber message» action has the following options:
Auth token
The authentication token (also known as application key) is a unique and secret account identifier. It is used to authenticate request
in the Viber API and to prevent unauthorized persons from sending requests.
The authentication token is generated upon account creation and can be viewed by the account's admins in the "edit info" screen of their
Public Account/bot or on the Viber Admin Panel.
It may look like 445da6az1s345z78-dazcczb2542zv51a-e0vc5fva17480im9
Receiver
Unique Viber user ID.
Macro variables are supported in this field (to be substituted with their actual values at the message generation time).
Note: Viber API allows accounts to send messages to Viber users who subscribe to the account. Sending a message to a user will be
possible only after the user has subscribed to the Public Account by pressing the subscribe button or by sending a message,
or by sending a message to a bot.
User may find its userID using POST {} request to https://chatapi.viber.com/pa/get_account_info with header X-Viber-Auth-Token: authtoken
Text
Provide text for the message.
Macro variables such as %TestName%, %Status%, %Reply%, %RelatedURL% are supported in this field
(to be substituted with their actual values at the message generation time).
This action sends a message through an Jabber server to the
specified Jabber client. You should specify parameters of your primary and backup (optional) Jabber accounts
on the Jabber page in the Options dialog.
In addition to the common action parameters, the "Send message to Jabber" action has
the following options:
Jabber account
Specify the Jabber user (client) to whom the message will be sent. More than one destination addresses
separating with a semicolon (;). Macro variables are supported in this field.
Message template
Select one of the existing mail templates (that will be used for the message generation) from drop down list
or click ![]() button to bring up the Mail Templates
dialog and create template for your preferences. Macro variables are supported in
message templates to be substituted with their actual values at the message generation time.
button to bring up the Mail Templates
dialog and create template for your preferences. Macro variables are supported in
message templates to be substituted with their actual values at the message generation time.
Sends a message through an ICQ server to the specified ICQ user.
You should specify parameters of your primary and backup (optional) ICQ accounts on the
ICQ page in the Options dialog.
In addition to the common action parameters, the «Send message to ICQ» action has the
following options:
ICQ # (UIN)
Specify the ICQ# to whom the message will be sent. More than one destination addresses separating with a
semicolon (;). Macro variables are supported in this field.
Message template
Select one of the existing mail templates (that will be used for the message generation) from drop down list or
click ![]() button to bring up the Mail Templates
dialog and create template for your preferences. Macro variables are supported in message
templates to be substituted with their actual values at the message generation time.
button to bring up the Mail Templates
dialog and create template for your preferences. Macro variables are supported in message
templates to be substituted with their actual values at the message generation time.
Please note: HostMonitor utilizes message queue, supports primary and backup ICQ accounts and uses some
other tricks to make message delivery as reliable as possible. However ICQ servers use anti-spam technologies
and may lock your account or do not accept your messages (temporarily). That's why you should not consider
"Send message to ICQ" action as reliable way to notify network administrators about critical network problems.
"Record HM log" action method allows you to store records in the log under some very specific circumstances.
It also provides you with ability to manage flexibly which information should or should not be added into the logs.
E.g. you may add info about passed probes into one log (using "good" action) and save info about failed probes into
another log file (using "bad" action). Or you may record results of some test item only when the "reply" is over
1500 ms (using "advanced" action with triggering expression '%Reply%'>'1500 ms').
Please use caution and do not create too many logs. Although Log Analyzer is capable of processing multiple log
files together, it takes more time to analyze many small files rather then one big file.
In addition to common action parameters, the "Record HM log" action has the following
options:
Add record into common log
Tells HostMonitor to record information about test result into common log file.
Add record into private log
Tells HostMonitor to record information about test result into private log file - log file that is assigned
specifically for the test item that has triggered action execution. Even if "Use private log" test's property
is not activated for this test item, record will be added when action is executed. However if there is no
private log specified (file name is empty) for the test item, no record will be added.
Add record into specific log
Tells HostMonitor to record information about test result into some specific log file. You may provide path to
html, text or dbf file, HostMontor will record data in appropriate format according to file extension.
HostMonitor can generate reports in HTML, DBF, WML, and Text formats. If you want to generate reports when some test
changes status, add "Generate reports" action into action profile. In addition to common action parameters
select one of the options:
Generate reports for the containing folder
With this option selected HostMonitor will create reports for the Folder in
which the test causing actions are contained. This option useful when you want to assign one action profile to
many different tests that located in different Folders. Each test will create reports for its own Folder.
"Generate reports for .."
Choose this option and select the Folder from drop-down list if you need to create reports for some specific Folder.
Recursive mode
This parameter defines whether HostMonitor includes subfolders to the
report or not. Choose one of the following options:
| - Single folder | Include specified folder only (no subfolders) |
| - Folder & all subfolders | Include specified folder and all descendant subfolders |
| - Folder & subfolders with inherited settings | Incude specified folder and subfolder which inherit reports' settings from the parent folder |
Use report pool
This option tells HostMonitor that report generation can be deferred for 1-2 seconds. In some cases this option noticeably reduces resource usage, e.g. if you use "Generate reports" action for many test items that can change status at the same time. However you should not use this option if report must be processed immediately; e.g. you are using 2nd action to send reports by e-mail or you are using some script to publish report on your web site.
As you see you do not specify report to generate directly. That is because each Folder contains list of up to 6 reports or Folder can inherit this list from the Parent Folder. For more information about Folders, refer to "TestList & Windows" section of this documentation.
Also you can use "Execute HMS script" action to generate some specific reports. For more information about Reports, refer to "Log&Reports" section of this documentation.
HostMonitor can send e-mail notification (that includes the problem data) to a mailbox, a pager or a mobile phone
using any SMTP server. On the Mailer settings page in the Options
dialog setup the parameters of your Primary and Backup SMTP servers (address of the server, port, authentication
method, login, password, etc).
In addition to the common action parameters, the «Send e-mail» action has the following
parameters:
From
Specify the email address of the sender.
To (recipients)
Specify a list of destinations for the mail message. A copy of the message is sent to each of them, and a "To" SMTP
header is created containing the destination addresses. More than one destination addresses separating with a
semicolon (;).
Also you can specify optional [cc:] and [bcc:] lists in this field. e.g.
admin@company1.com [bcc:] manager@company1.com
admin1@dom1.com; admin2@dom1.com [cc:] manager@dom1.com [bcc:] hr2@dom1.com; hr5@dom1.com
Macro variables may be used in this field. If you use several variables for list of recipients and some of
these variables represent empty string or not specified at all, HostMonitor removes such empty entries from the list. This way
mail server will not generate error when your setup allows using of empty variables. Note: HostMonitor does not remove variables
from action settings, it removes blank addresses from data transmitted between HostMonitor and mail server.
Priority
Priority option allows you to assign the message a priority so the recipient knows to either look at it right away
(High Priority) or read it when time permits (Low Priority).
Subject
The subject of the mail message. Macro variables may be used in the subject line.
Mail template
Select one of the existing mail templates that will be used as a body of the mail (text) from drop down list or
click ![]() button to bring up the Mail Templates
dialog and create mail template for your preferences. Macro variables are supported in message
templates to be substituted with their actual values at the message generation time.
Also you can specify a particular character set for your mail templates.
button to bring up the Mail Templates
dialog and create mail template for your preferences. Macro variables are supported in message
templates to be substituted with their actual values at the message generation time.
Also you can specify a particular character set for your mail templates.
Attach file
You can mark this option and select file that will be attached to the message. Enter the path manually or press
![]() button to select a file from the Open File dialog.
button to select a file from the Open File dialog.
In addition to standard macro variables, the following variables can be used when you specify path to attachment file:
- %NewestFile% - newest file in specified folder
- %OldestFile% - oldest file in specified folder
- %NewestFolder% - newest sub-folder
- %OldestFolder% - oldest sub-folder
HostMonitor can send message to your alpha-numeric pager(s) using the TAP protocol.
For this you need a modem and a phone line connected to the computer.
On the Pagers page in Options dialog you can setup general
modem settings.
In addition to the common action parameters, you will need to fill out some information
about the paging company and pager of the person you wish to send a message to. These parameters can be different
for each action.
What do you need to know about the paging company of the pager?
Access Number
You need to know the paging terminals alphanumeric
paging access telephone number. This is the phone number of the modem at the paging company that will receive the
message using the TAP protocol. This number is the same for everybody that has a pager from that company.
Many carriers will offer 800 numbers - especially the nationwide guys like SkyPage or Mobilcomm.
THIS IS DIFFERENT FROM THE PAGER TELEPHONE NUMBER. You may include dashes and commas like any
other modem phone number (a comma usually pauses 2 seconds - i.e. 9,444-4444).
By putting "DIRECT" in this string, the program assumes a direct connection. No dialing takes place and DTR is NEVER dropped.
If the phone number is in the format +1 (303) 799-0055 that is called canonical form, the access phone number will be TAPI converted to a dialable number. In this manner you can always send the area code and it will know if it is a local or long distance call. It will also dial the prefix digit (such as 9) to get outside line - etc.
Password
Does your paging carrier require a password? Most US
companies DO NOT. In this case, the program sends six zeros as the
password. This is the standard way of doing it. If you require a
special password, define it in this field.
Max characters per block
This is the number of characters the paging company
allows per message block. This number varies widely from company to company.
Some are as small as 60 characters and some are as big as 1000 characters.
The norms seem to be 80 and 230 characters per block.
You will need to find out this information or learn this through trial and error.
If the message you pass is bigger than the character per block limitation,
the program automatically splits your message up into multiple blocks, so the recipient gets the entire message.
However, he/she does get a different page for each block.
Parity
Specifies the parity, data bits, stop bits that the paging company's alpha access port communicates at.
In very rare cases the paging terminal require N,8,1 rather than E,7,1.
What do you need to know about the Pager?
Pager ID
The only thing you need to know about the pager is the pager phone number or the Pager ID (Alpha PIN).
DO NOT INCLUDE ANY DASHES in this number.
Macro variables may be used in this field.
Mail template
Select one of the existing mail templates (that will be used for the message generation) from drop down list or
click ![]() button to bring up the Mail Templates
dialog and to create the template for your preferences. Macro variables are supported in
message templates to be substituted with their actual values at the message generation time.
button to bring up the Mail Templates
dialog and to create the template for your preferences. Macro variables are supported in
message templates to be substituted with their actual values at the message generation time.
This action sends a message to a pager using the SNPP protocol; unlike TAP protocol, which employs the modem, SNPP
is built on top of TCP/IP to send messages via an Internet connection.
In addition to the common action parameters, «Send message to pager (SNPP)» action has the
following options:
PagerID
Specify the Pager ID (PID) number. Macro variables may be used in this field.
Mail template
Select one of the existing mail templates (that will be used for the message generation) from drop down list or
click ![]() button to bring up the
Mail Templates dialog and to create the template for your preferences.
Macro variables are supported in message templates to be substituted with their actual values
at the message generation time.
button to bring up the
Mail Templates dialog and to create the template for your preferences.
Macro variables are supported in message templates to be substituted with their actual values
at the message generation time.
Server
Specify the name or IP address of the SNPP server.
Port
The default SNPP port is 444, but you can specify a non-standard port.
Login as
This parameter allows for a session login ID to be specified. It is used to validate the person attempting to access
the paging terminal. If this option is disabled, "anonymous" user status is assumed.
HostMonitor can send messages to "numeric only" pagers (beepers). TAP protocol is not used in these cases.
The program simply takes the phone line off-hook, dials the pager phone number, waits specified number of seconds, touch tones the digits to be displayed on the pager and hangs up.
This method does not guarantee delivery to the paging company. It just dials and hopes it works.
In addition to the common action parameters, the «Send message to beeper» action has the
following options:
Beeper #
Enter the telephone number for the beeper. This is the number on the beeper that people call to touch tone in digits.
You may use a comma in the number, the comma tells the modem to wait 2 seconds.
Macro variables may be used in this field.
Delay
Specify how many seconds to delay from the time the beeper number dialed and the display digits are dialed.
Send message
This parameter defines the digits that will appear on the pager. You may use macro variables
(e.g. "%StatusID%", "%HostID%", "%CommentID%") and comma (for 2 seconds delay).
Termination string
Define the modem command used to terminate a call. Normally, this parameter is empty and HostMonitor uses a "#,H;"
to finish the call. The # is normally used when you have finished touch-toning in the digits to send to the pager.
The comma tells the modem to wait 2 seconds before hanging up. The "H" tells the modem to hang up when it is
done. The semi-colon puts the modem in command mode and sends an OK to the computer when it has finished dialing.
Setup general paging settings on the Pagers page in Options dialog.
"Send SMS (GSM)" action sends SMS messages through a GSM modem (cell phone) connected to the system where
HostMonitor is running. You should specify parameters of your primary and backup (optional) GSM modems on the
GSM page in the Options dialog.
In addition to the common action properties, the "Send SMS (GSM)" action has the
following parameters:
Destination phone
Provide phone number to which the message should be sent. More than one recipients separating with a
semicolon (;). For example "+12063979723;+1555204090". Macro variables are supported in this field.
Message class
Choose class of the message:
- 0..Display immediately
- 1..ME (mobile equipment)
- 2..SIM
- 3..TE (terminal equipment)
The most of mobile phones support message class 0 and 2.
Message template
Select one of the existing mail templates that will be used as a body of the mail (text) from drop down list or
click ![]() button to bring up the Mail Templates
dialog and create mail template for your preferences.
Macro variables are supported in message templates to be substituted with their actual
values at the message generation time.
button to bring up the Mail Templates
dialog and create mail template for your preferences.
Macro variables are supported in message templates to be substituted with their actual
values at the message generation time.
If a message is longer than 160 characters, HostMonitor will split the message and send several SMS to the
recipient. If this is not really necessary, we recommend using compact mail templates for "Send SMS (GSM)" action.
"Send SMS (SMPP/IP)" action sends SMS messages through a SMPP network service providers (SMSC) using TCP/IP
connection. You should specify parameters of your primary and backup (optional) SMPP accounts on the
"SMS: SMPP" page in the Options dialog.
In addition to the common action properties, the "Send SMS (SMPP/IP)" action has the
following parameters:
Destination phone
Provide phone number to which the message should be sent. More than one recipients separating with a
semicolon (;). For example "+12063979723;+1555204090". Macro variables are supported in this field.
Destination TON
Choose the Type of Number (TON) for the "Destination phone":
- Unknown
- International
- National
- Network Specific
- Subscriber Number
- Alphanumeric
- Abbreviated
Destination NPI
Choose the NPI for the "Destination phone".
- Unknown
- ISDN (E163/E164)
- Data (X.121)
- Land Mobile (E.212)
- National
- Private
- ERMES
- Internet (IP)
Message template
Select one of the existing mail templates that will be used as a body of the mail (text) from drop down list or
click ![]() button to bring up the Mail Templates
dialog and create mail template for your preferences.
Macro variables are supported in message templates to be substituted with their actual
values at the message generation time.
button to bring up the Mail Templates
dialog and create mail template for your preferences.
Macro variables are supported in message templates to be substituted with their actual
values at the message generation time.
If a message is longer than 160 characters, HostMonitor will split the message and send several SMS to the
recipient. If this is not really necessary, we recommend using compact mail templates for "Send SMS (SMPP/IP)" action.
Microsoft Windows NT* supports an application type known as a service. HostMonitor can stop these
applications on local or remote computers (if you have an account with privileges for starting/stopping services).
Here "Windows NT" means system based on NT technology, including Microsoft Windows NT 4.0, Windows 2000, Windows XP, Vista, Windows Server 2003 and 2008, Windows 7.
In addition to the common action parameters, the «Stop service» action has the following
options:
Computer name
Provide the name of the target system (the target computer name must be prefixed by "\\") or select the
"<local computer>" item to stop the service on a local machine. You may use the "Browse network" button to
select a computer from the list. Also you can use macro variables (e.g. %ServiceComp%,
%ServiceName%) in this field.
Service name
Name of the service to stop. You may select the service from the drop-down list. You can use macro variables in this field as well.
Comma separated lists are supported, HostMonitor can stop several services one by one. E.g. you may use %Reply% variable for action triggered by Service test that checks ALL "Auto" services.
Parameters
Parameters string passed to the service.
Connect as
To stop a service on remote Windows system you may mark this options and provide a username and a password for a connection to the target computer.
Also Connection Manager can be used (when ConnectAs option is not marked)
Microsoft Windows NT* supports an application type known as a service. HostMonitor can start these
applications on local or remote computers (if you have an account with privileges for starting/stopping services).
Here "Windows NT" means system based on NT technology, including Microsoft Windows NT 4.0, Windows 2000, Windows XP, Vista, Windows Server 2003 and 2008, Windows 7.
In addition to the common action parameters, the «Start service» action has the following
options:
Computer name
Provide the name of the target system (the target computer name must be prefixed by "\\") or select the
"<local computer>" item to start the service on a local machine. You may use the "Browse network" button to
select a computer from the list. Also you can use macro variables (e.g. %ServiceComp%,
%ServiceName%) in this field.
Service name
Name of the service to start. You may select the service from the drop-down list. You can use macro variables in
this field as well.
Comma separated lists are supported, HostMonitor can start several services one by one. E.g. you may use %Reply% variable for action triggered by Service test that checks ALL "Auto" services.
Parameters
Parameters string passed to the service.
Connect as
To start a service on remote Windows system you may mark this options and provide a username and a password for a connection to the target computer.
Also Connection Manager can be used (when ConnectAs option is not marked)
Microsoft Windows NT* supports an application type known as a service. HostMonitor can restart these
applications on local or remote computers (if you have an account with privileges for starting/stopping services).
Here "Windows NT" means system based on NT technology, including Microsoft Windows NT 4.0, Windows 2000, Windows XP, Vista, Windows Server 2003 and 2008, Windows 7.
In addition to the common action parameters, the «Restart service» action has the following
options:
Computer name
Provide the name of the target system (the target computer name must be prefixed by "\\") or select the
"<local computer>" item to restart the service on a local machine. You may use the "Browse network" button to
select a computer from the list. Also you can use macro variables (e.g. %ServiceComp%,
%ServiceName%) in this field.
Service name
Name of the service to restart. You may select the service from the drop-down list. You can use macro variables in
this field as well.
Comma separated lists are supported, HostMonitor can restart several services one by one. E.g. you may use %Reply% variable for action triggered by Service test that checks ALL "Auto" services.
Do not start service if it was stopped prior to execution of the action
This option is useful when you want to stop service (e.g. for maintenance purpose) without disabling the test.
Connect as
To restart a service on remote Windows system you may mark this options and provide a username and a password for a connection to the target computer.
Also Connection Manager can be used (when ConnectAs option is not marked)
HostMonitor can reboot or shut down remote Windows NT* system. To shut down a remote computer, the calling
process must have the SE_REMOTE_SHUTDOWN_NAME privilege on the target system. By default Administrators have this
privilege.
Here "Windows NT" means system based on NT technology, including Microsoft Windows NT 4.0, Windows 2000, Windows XP, Vista, Windows Server 2003 and 2008, Windows 7.
In addition to the common action parameters, define the following options:
Computer name
Provide the name of the target system (the target computer name must be prefixed by "\\"). You may use the
"Browse network" button to select a computer from the list. Also you can use macro variables
(e.g. %HostAddr%) in this field.
Message to display
Provide a message to display on the remote system before shutdown.
Time to display
If time is not zero, system displays a dialog box on the specified computer. The dialog box displays the name of the
user who called the function, displays the message, and prompts the user to log off. The dialog box beeps when it
is created and remains on top of other windows in the system. The dialog box can be moved but not closed. A timer
counts down the remaining time before a forced shutdown. If the user logs off, the system shuts down immediately.
Otherwise, the computer is shut down when the timer expires.
If you set time to zero, the computer shuts down without displaying the dialog box.
Method
Select one of the 2 options:
- Reboot - shuts down the system and then reboots.
- Shutdown - shuts down the system to a point at which it is safe to turn off the power.
Force processes to terminate
During a shutdown or reboot operation, applications that are shut down are allowed a specific amount of time to respond to the shutdown request. If the time expires, the system displays a dialog box that allows the user to forcibly shut down the application, to retry the shutdown, or to cancel the shutdown request. If the "Forces processes to terminate" option is enabled, the program sets flag EWX_FORCE and the system always forces applications to close and does not display the dialog box. When this flag is set, the system does not send the WM_QUERYENDSESSION and WM_ENDSESSION messages. This can cause the applications to lose data. Therefore, you should only use this flag in an emergency.
HostMonitor can reboot local Windows system as well.
In addition to the common action parameters, choose 1 of 4 reboot Methods:
- Logout - Shuts down all processes running in the current security context, logs the user off.
- Reboot - Shuts down the system and then reboots.
- Shutdown - Shuts down the system to a point at which it is safe to turn off the power.
- Poweroff - Shuts down the system and turns off the power. The system must support the power-off feature.
Force processes to terminate
During a shutdown or log-off operation, applications that are shut down are allowed a specific amount of time to respond to the shutdown request.
If the time expires, the system displays a dialog box that allows the user to forcibly shut down the application, to retry the shutdown, or to cancel the shutdown request.
If the "Forces processes to terminate" option is enabled, the program sets flag EWX_FORCE and the system always forces applications to close and does not display the dialog box.
When this flag is set, the system does not send the WM_QUERYENDSESSION and WM_ENDSESSION messages.
This can cause the applications to lose data. Therefore, you should only use this flag in an emergency.
When you reboot a local Windows 2000/XP/2003 (or any newer version of Windows system) HostMonitor uses another flag: EWX_FORCEIFHUNG.
This flag forces processes to terminate only if they do not respond to the WM_QUERYENDSESSION or WM_ENDSESSION message.
Name of this action tells for it self, it launches specified external application. In addition to the
common action parameters it has 2 more parameters:
Command line
Specify command line to launch external application. Macro variables may be used in the command line.
Working directory
You may specify current drive and directory for the process (full path is recommended).
If you do not specify working directory, the new process will have the same current directory as the calling process (HostMonitor).
Window mode
This parameter specifies how the application window will be shown. Choose one of the possible options:
| SW_SHOWNORMAL | - | displays an application window in its original size and position. |
| SW_HIDE | - | starts application without displaying its window. |
| SW_MAXIMIZE | - | displays an application window as a maximized window. |
| SW_MINIMIZE | - | displays an application window as a minimized window. |
| SW_SHOWMINNOACTIVE | - | displays an application window as a minimized window. The active window remains active. |
| SW_SHOWNOACTIVATE | - | displays an application window in its original size and position. The active window remains active. |
Knows problems:
If you are using Windows Vista or newer version of the system, UAC is enabled and HostMonitor running as Win32 service cannot start external applications, you may need to assign "Replace a process level token" right to the account (user account used for HostMonitor service). Local Computer Policy -> Computer Configuration -> Windows Settings -> Security Settings -> Local Policies -> User Rights Assignment -> Replace a process level token -> Properties -> Add User or Group, then restart system
HostMonitor may start specified process on remote Windows systems.
If the newly created process attempts to interact with objects on the target system without the appropriate access privileges, it will be terminated without notification.
Also for security reasons this method cannot be used to start an interactive process remotely.
If you cannot use administrator account or you need to start interactive process on remote system, you may use
Remote Monitoring Agent running on target system and
Execute external program action.
In addition to the common action parameters, «Start program remotely» action has the following options:
Start process on
Provide the name or IP address of the target system . You may use the
"Browse network" button to select a computer from the list. Also you may use macro variables
(e.g. %HostAddr%) in this field.
Command line
Specify command line to launch external application. Macro variables may be used in the command line.
Working directory
You may specify current drive and directory for the process (full path is recommended).
If you do not specify this path, %SystemRoot%\system32\ directory will be used.
User/password
Provide account that will be used for authentication on remote system (administrator account required). If you keep user field empty, then HostMonitor will use account specified in
Connection Manager (account for WMI test related to target system).
HostMonitor may kill specific process on local or remote Windows system. You may setup Dominant Process
test to check for processes that use too much of CPU resources, handles or memory and use "Kill process", "Start program remotely" actions
to restart "bad" processes (NOTE: some processes may lose data when you kill them).
In addition to the common action parameters, the «Kill process» action has the following options:
Kill process on
Provide the name or IP address of the target system . You may use the
"Browse network" button to select a computer from the list. Also you may use macro variables
(e.g. %HostAddr%) in this field.
Kill by name
Use this option when you need to kill process using its name, e.g. chrome.exe. HostMonitor will kill all instances of the process.
Macro variables may be used, e.g. if action triggered by Dominant Process test method, you may use %ProcessName% variable.
Kill by proc ID
Use this option when you know process ID. HostMonitor will kill single instances of the process.
Macro variables may be used, e.g. if action triggered by Dominant Process test method, you may use %ProcessID% variable.
User/password
Provide account that will be used for authentication on remote system. If you keep user field empty, then HostMonitor will use account specified in
Connection Manager (account for WMI test related to target system).
Event logging in Microsoft Windows NT* provides a standard, centralized way for applications (and the
operating system) to record important software and hardware events. The event-logging service stores events from
various sources in a single collection called an event log.
Here "Windows NT" means system based on NT technology, including Microsoft Windows NT 4.0, Windows 2000, Windows XP, Vista, Windows Server 2003 and 2008, Windows 7.
The Log Event action form allows you to add or edit an action that will log a record to the Event Log. Entries in
the event log can be viewed with the Event Viewer or used by the other software utilities that perform centralized
alerting from the event log.
In addition to the common action parameters, the "Log Event" action has the following
parameters:
Computer
The UNC (Universal Naming Convention) name of the server on which the event should be recorded (the target computer
name must be prefixed by "\\"). Type the UNC or select the "<local computer>" item. You can use
macro variables (e.g. %HostAddr%) in this field.
Log
Provide name of the log file. This can be the Application, Security, System log file, or a custom registered log
file.
Event source
Select source of the events from drop down list. You can use macro variables (e.g. %CommentLine2%)
in this field.
Event type
Choose type of the event to be logged. This parameter can have one of the following values:
- Error
- Warning
- Information
Event ID
Specify event identifier. If you use "HostMonService" as Event Source, use ID within range 2001..2099. This range is reserved for users' messages. HostMonitor does not and will not use IDs from this range.
Description
Provide description of the event (this field is optional). You can use macro variables (e.g. %TestName%, %Status%, %Reply%, etc) in this field.
Connect as
To log event on the remote system you can mark this option and provide username and password for the connection to the target computer.
Executes an SQL query against the specified ODBC data source. In addition to the common action parameters,
the «SQL Query » action has the following parameters:
ODBC data source
Choose one of ODBC data sources available on your system (if action should be performed by RMA, HostMonitor
will show ODBC sources list retrieved by the agent on remote host).
Macro variables are supported, e.g. you may use folder-related variable %fvar_datasource%, this way single action
profile assigned to different test items may send requests to different databases
Login
Specify user identifier, if necessary.
Some ODBC drivers (e.g. MS SQL ODBC Driver version 13.1+) support Integrated Windows authentication and Active Directory Integrated
authentication. In this case you may type WindowsAuth instead of login name (for Integrated Windows authentication) or set
ADAuth as login name (for Active Directory Integrated authentication). Password field is not used in such case.
Password
Specify password, if necessary.
SQL Query
Specify SQL query to execute. Macro variables are supported in the query to be substituted with their actual values at the action execution time.
Timeout
Specify the number of seconds to wait for a login request to complete.
Reliability / Known problems
If you are using SQL Query action, you must be sure that ODBC driver (provided by 3rd party) works reliable and will not cause HostMonitor to crash. E.g.
- Microsoft dBase Driver v 4.00 causes resource leakage;
- Oracle drivers v8 and v10 have many "bugs" and may crash application;
- Old MySQL ODBC drivers v3 cause handles leakage in multithreaded environment;
- MySQL ODBC drivers version 8.00.11 - 8.00.15 may lead to various problems as well, including memory access violations. If you need
to use MySQL ODBC driver version 8.x, please set two options in hostmon.ini file, [Misc] section:
[Misc]
ODBC_UseSharedEnvHandle=1
ODBC_KeepSharedEnvHandle=1
Sends HTTP request to the specified Web server. In addition to the common action
parameters, the «HTTP request» action has the following options:
Host
This is the domain name or the IP address of the target web server (e.g. www.mywebserver.com).
HostMonitor can perform HTTPS requests as well - if you need HTTPS request, specify target host using
https:// prefix (e.g. https://www.google.com). For HTTP requests you may use http:// prefix or specify host name without any prefix (e.g. www.google.com).
Note: HostMonitor will perform request even for hosts with invalid certificates (expired or certificate with wrong hostname).
Port
A valid TCP port number (a value between 1 and 65535). Usually port 80 used for HTTP requests, port 443 for HTTPS
Request
Provide data to send to the host. Macro variables are supported.
"HTTP request" action applies URL encoding rules to macro variables. E.g. if test status is
"Host is alive", %Status% variable will be translated to Host%20is%20alive.
Some exceptions:
if Content-Type: application/json specified, then HostMonitor will use JSON encoding rules.
If hmvars: text HTTP header specified, then HostMonitor will not encode variables.
You may send HEAD, GET, DELETE, POST or PUT requests. POST/PUT data should be provided in Request field, separated from header with 1 empty line. If you do
not specify content-type for POST request, HostMonitor will use default type (Content-Type: application/x-www-form-urlencoded).
Also, HostMonitor adds <cr><lf><cr><lf> (empty line) after each request (according to HTTP protocol).
For example you may send messages to SLACK messenger using HTTP Request like the following
Host: https://hooks.slack.com
Port: 443
Request:
POST https://hooks.slack.com/services/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 HTTP/1.1
Host: hooks.slack.com
Content-Type: application/json
{"channel": "#hmonitor", "username": "tom", "text": "TestName:%TestName%
Status: %Status%
Reply: %Reply%
Recurrences: %Recurrences%", "icon_emoji": ":ghost:"}
Sends data to the specified host using TCP or UDP protocol. In addition to the common action parameters,
the «Send data to TCP/UDP port» action has the following options:
Server
This is the domain name or the IP address of the target host.
Port
A valid port number (a value between 1 and 65535) is required for the connection to take place.
Protocol
Select the protocol to use: TCP or UDP.
Init packet (string) to send
Provide data to send to the host. In this field you can use regular text; macro variables;
and sequences formatted %XX where XX is a hexadecimal code of a character (byte). E.g. define this parameter
like: «%TestName% %0D%0A %Status% %0D%0A %DateTime%» to send 3 text lines with
the information about the test, its status, and current time.
Wait for answer
Specify how many seconds HostMonitor should wait for an answer before sending Final packet.
Final packet (string) to send
Provide this parameter if you need to send two information packets with the pause between them to the host. The
same as for the Init Packet parameter, in this field you can use regular text; macro variables;
and sequences formatted %XX where XX is a hexadecimal code of a character (byte).
This action sends data using the Syslog protocol. Syslog is the standard event logging subsystem for Unix, also you
can find Syslog service for Windows.
Syslog daemon receives standard UDP Syslog messages sent from routers, switches, UNIX hosts, HostMonitor, other
network devices and can displays the details on screen, log to files, terminal devices, etc. Syslog also allows you
to forward log entries to another machine for processing, in this way syslog functions as a distributed error
manager.
In addition to the common action parameters, the «Syslog» action has the following
parameters:
Server
This is the name or IP address of the Syslog server.
Port
The default SNPP port is 514, but you can specify a non-standard port.
Message
Provide text message to send. Macro variables are supported in the message to be substituted
with their actual values at the action execution time.
Severity
Log messages are prioritized by a combination of facility and urgency level. Levels (severity) can be considered
various levels of a problem (e.g. warning, error, emergency) whereas facilities are considered to be service areas
(e.g. printing, email, network, etc). The levels available are the following:
| - | Emergency | A panic condition. System is unusable. |
| - | Alert | A condition that should be corrected immediately, such as a corrupted system database. |
| - | Critical | Critical conditions, e.g., hard device errors. |
| - | Error | Errors. |
| - | Warning | Warning messages. |
| - | Notice | Conditions that are not error conditions, but should possibly be handled specially. |
| - | Info | Informational messages. |
| - | Debug | Messages that contain information normally of use only when debugging a program. |
Facility
Facility is a number that considered as a service area. The various facilities are listed below:
| 0 | kernel messages |
| 1 | user-level messages (messages generated by random user processes) |
| 2 | mail system |
| 3 | system daemons |
| 4 | security/authorization messages |
| 5 | messages generated internally by syslogd |
| 6 | line printer subsystem |
| 7 | network news subsystem |
| 8 | UUCP subsystem |
| 9 | clock daemon |
| 10 | security/authorization messages |
| 11 | FTP daemon |
| 12 | NTP subsystem |
| 13 | log audit |
| 14 | log alert |
| 15 | clock daemon |
| 16-23 | reserved for local use |
Sets data on the local or remote system using the SNMP protocol. The Simple Network Management Protocol is the
Internet standard protocol for exchanging management information between management console applications and
managed entities (hosts, routers, bridges, hubs, etc). Using this protocol HostMonitor can change settings of
your network devices.
In addition to the common action parameters, the «SNMP Set» action has the following parameters:
Agent address
Provide address of the target system. Specify either a dotted-decimal IP address or a host name that can be resolved
to an IP address, an IPX address (in 8.12 notation), or an Ethernet address. You can use macro variables
(e.g. %HostAddrB%) in this field.
Community
Specify the SNMP community name used when communicating with the device specified in the Agent Address parameter.
By default on SNMP systems this is "PUBLIC" but it can be different on your systems.
Timeout
This is the amount of time in seconds the program will wait for a response from the server before the request fails.
Retries
Specify the communications retries count.
OID
The name that uniquely identifies the object, the value of which you have to change. For example OID "1.3.6.1.2.1.2.1"
represents the number of network interfaces on which system can send/receive IP datagrams; OID "1.3.6.1.2.1.6.9"
represents the number of TCP connections for which the current state is either ESTABLISHED or CLOSE-WAIT; etc. To
get a list of valid OIDs for your SNMP enabled devices you should contact the vendor of the device. They should be
able to give you a MIB file that contains all the OIDs for the device.
Set value
Define a new value for the object that HostMonitor has to set (please note some object can be read-only). Use
"Get current value" button to retrieve current value of the object.
You can use macro variables (e.g. %HostAddr%) in this field.
Sends a message to the Management Station using the SNMP protocol. The SNMP (Simple Network Management Protocol) is
the Internet standard protocol for exchanging management information between management console applications and
managed entities (hosts, routers, bridges, hubs, etc).
In addition to the common action parameters, the "SNMP Trap" action has the following
parameters:
Destination address
Here you should provide the host name (e. g. mail.maincorp.com) or IP address (e. g.
204.71.200.68) of the host that will receive SNMP Trap messages. This machine should be running a SNMP console
in order to receive the trap message. You can use macro variables (e.g. %HostAddr%) in this field.
Also you may provide IPv6 addresses (e.g. fe80::370:ff56:fed5:22) and specify hostname with suffixes
::ipv4 or ::ipv6 (e.g. www.google.com::ipv4
or www.6bone.net::ipv6). If you specify hostname without any suffix, HostMonitor will try to resolve name into
IP address using IPv4 protocol. If name cannot be resolved by IPv4 protocol, HostMonitor will try to use IPv6 protocol. If you specify
hostname with ::ipv4 or ::ipv6 suffix, HostMonitor will use IPv4
(or IPv6) protocol only.
Note: on Windows NT 4.0, Windows 2000 and Windows XP SP1 IPv6 protocol is not supported. You may use menu Tools -> Local Info
to check is your system IPv6 ready.
Also you may specify non-standard UDP port. Port number can be provided after a colon following the destination address
(e.g. 195.168.10.10:1162). You cannot specify port number when target host specified with ipv4/ipv6 suffix.
Agent address
Provide IP address of the agent that generated the SNMP Trap. If you keep default value "localhost", HostMonitor
will use IP address of the system where it is running. You can use macro variables
(e.g. %HostAddr%) in this field.
Community
Specify the SNMP community name used for this trap. The default community for most systems is "public". The
community string must match the community string used by the SNMP console.
Enterprise
Identifies the type of the object causing the trap. You can use macro variables
(e.g. %CommentLine1%) in this field.
Trap type
Choose one of the generic trap types:
- Cold Start
- Warm Start
- Link Down
- Link Up
- Authentication Failure
- EGP Neighbor Loss
- Enterprise Specific
Specific
If Trap type is Enterprise Specific, provide an ID of the trap.
MIB OID
SNMP Trap message can include OID relevant to the message and its value. Define object identifier in this field (object identifier is the name that uniquely identifies the object, e.g. OID "1.3.6.1.2.1.2.1" represents the number of network interfaces on which system can send/receive IP datagrams). You can use macro variables (e.g. %CommentLine2%) in this field.
MIB Value
Define an object's value. You can use macro variables (e.g. %CommentLine2%) in this field as well.
MIB Type
Choose type of the data. It can be one of the following:
- NULL
- INTEGER
- OCTET STRING
- OBJECT IDENTIFIER
- IP ADDRESS
- UNSIGNED32
- COUNTER
- GAUGE32
- TIMETICKS
- OPAQUE
- COUNTER64
This action allows establishing dial-up connection to a network. E.g. HostMonitor can establish backup connection in
case of primary channel malfunction. In addition to the common action parameters, the
«Dial-up to the network» action has the following options:
Dial-up connection
Select from drop down list the remote access entry to establish the connection.
User name
Specify the user's name. This parameter is used to authenticate the user's access to the remote access server. If
the user name is empty string (""), HostMonitor uses the user name of the current logon context for authentication.
For a user-mode application, RAS uses the credentials of the currently logged-on interactive user. For a Win32
service process, RAS uses the credentials associated with the service.
Password
Specify the user's password. This parameter is used to authenticate the user's access to the remote access server.
If the password is empty string (""), HostMonitor uses the password of the current logon context for authentication.
For a user-mode application, RAS uses the credentials of the currently logged-on interactive user. For a Win32
service process, RAS uses the credentials associated with the service.
Save password
This option has sense only if Password parameter is not an empty string. Specifies whether to save the password (in
the phone-book entry) for the user indicated by User Name parameter or not. If "Save password" option is disabled,
the password will be removed. Disabling option is equivalent to checking the "Unsave Password" checkbox in Dial-Up
Networking dialog.
Show dial-up dialog
With this option enabled HostMonitor will display a popup window when establishing the connection, and will display
dial-up process information in it.
Retries
Set the number of times the dial-up connection is automatically redialed if the first attempt to connect fails.
Purpose of this action is to drop the specified dial-up connection (e.g. in case if the main channel will restore
its functioning). In addition to the common action parameters, the «Disconnect from network»
action has only one parameter:
Dial-up connection
Select from drop down list the remote access connection to terminate.
This action simply forces the program to perform the test one more time (not waiting until time of the test interval
is elapsed).
In addition to the common action parameters, you may select one of the following options:
"Repeat test itself" or "Recheck dependant test items".
Repeat test itself
This action can be helpful in situations when the condition being checked is not stable. If, for some reason, the
accuracy of the test is questionable, you can add this action into alert profile, and take the necessary measures
based on the results of the follow-up test.
Recheck dependant test items
This option tells HostMonitor to recheck dependant test items (items that depend on Master test which triggered this action).
You may want to use this action is some special cases when "Recheck dependant test items when master test status has been changed"
option located on Behavior page in Options dialog is disabled.
This action allows changing the test time interval. In addition to the common action parameters
choose one of the options:
- Restore original value - restores the original test time interval that was defined by user using Test Propetries dialog
- Set to HH:MM:SS - set interval to the specific value
- Set to N% of the current value - increases or decreases the current test time interval by the specified amount of times.
Note: "Change test interval" action may set new interval for tests with irregular schedule as well. Action
changes type of the schedule to "regular", keeps old type in memory so it can be restored by "Change test
interval" action with "Restore original interval" option. However "Set to N% of the current value" option
cannot be applied for tests with "irregular" schedule.
This is very flexible action because script file may contain various commands for the program and tests control. In
addition to the common action parameters, the «Execute HMS script» action has only one
parameter:
Script file - specify full path to the script file or click small button on right side and select file from the Open File dialog.
HostMonitor Script file (file extension .HMS) is a text file that contains commands for HostMonitor. You can create
and edit script file using any text editor (e.g. notepad). Some examples when this action method can be useful:
- Assuming that you have dynamically (real-time) database with list of servers to monitor. When database is
changing HostMonitor can reload the list of tests or import new tests automatically. To implement this behavior
add test to monitor changes in the database (e.g. "File Integrity" test or "ODBC Query" test), and add "Execute
HMS script" action to the action profile that assigned to the test to run a script like:
ExecuteProgram 10000 c:\database\generator.exe c:\database\database.dbf c:\HostMon\import1.txt
NewTestList
ImportFromFile c:\HostMon\import1.txt
SaveTestList c:\HostMon\temp1.hml
- Assuming that you need to monitor 200 web servers in the Internet, but your LAN uses just one router to access
to the Internet. Of course if your router goes down, HostMonitor will start hundreds alerts. To avoid
unnecessary alerts make next steps:
- add ping test to check the router;
- set interval for this test less than intervals for Internet tests (e.g. 30 sec for router and 5 min for each web server);
- create 2 scripts: one for "Bad" action that will be executed when router will die, another for "Good" action that will be executed when router will restore operability.
"Bad" script:
DisableTest _AllTCP
DisableTest _AllURL
"Good" script:
EnableAllTests
If you use HostMonitor version 3.0 or higher, this is not a topical example. You do not need to disable/enable tests, you can just assign router ping test as a Master test for all web tests.
HMScript
HostMonitor Script file (file extension .HMS) is a text file that contains commands for HostMonitor. You can create and edit script file using any text editor (e.g. notepad). Some common rules:
- You can put only one command in each line
- Comments: The program ignores all strings with a semicolon (;) as the 1st character
- Commands: commands are case insensitive (e.g. "LoadTestList" and "LOADTESTLIST" means the same)
- Parameters: parameters are case sensitive
- HostMonitor version 3.0 or higher supports macro variables (%HostName%, %Comment%, %Folder%, etc.). Please note:
- if script is launched as a result of a test performance, the test's parameters are used for macros;
- if script is launched manually (using menu File->Execute Script), parameters of the selected test are used for the macros (if no test is selected, macros are not translated)
| Command | Parameter(s) | Description | ||||||||||||||||||||||||||||||||||||||||||||||||||||||||||||||||||
| - TestList operations | ||||||||||||||||||||||||||||||||||||||||||||||||||||||||||||||||||||
| NewTestList | [DiscardChanges] | Creates new empty TestList. Use optional DiscardChanges parameter to create new test list without saving current list of tests | ||||||||||||||||||||||||||||||||||||||||||||||||||||||||||||||||||
| LoadTestList | <FileName.HML> | Loads an existing TestList | ||||||||||||||||||||||||||||||||||||||||||||||||||||||||||||||||||
| AppendTestList | <FileName.HML> | Appends data to the current TestList from a specified HML file | ||||||||||||||||||||||||||||||||||||||||||||||||||||||||||||||||||
| ImportFromFile | <FileName> [SkipDuplicates] [WriteLog] |
Imports tests from special Text file. SkipDuplicates - optional parameter, HostMonitor will skip test when test with the same name already present in the TestList. WriteLog - optional parameter, HostMonitor will record to the system log file information about all errors and warnings during the import process. | ||||||||||||||||||||||||||||||||||||||||||||||||||||||||||||||||||
| SaveTestList | [<FileName>] | Saves the current list using its current or new file name. Parameter is optional when current list was loaded from the file (in this case HostMonitor knows the name of the file). You must specify a name of the file when you have created a new list. | ||||||||||||||||||||||||||||||||||||||||||||||||||||||||||||||||||
| ExportHMLintoText | <FileName> [-SF] [-SL] |
This command tells HostMonitor to export test settings into specified text file. Optional parameters: -SF - comment destination folders; -SL - comment test links | ||||||||||||||||||||||||||||||||||||||||||||||||||||||||||||||||||
|
Note: HostMonitor doesn't save changes when executes script. If you need to save modified list of tests, use SaveTestList command.
Examples: NewTestList LoadTestList c:\list1.hml AppendTestList c:\list2.hml ImportFromFile c:\import1.txt SkipDuplicates WriteLog SaveTestList c:\list3.hml | ||||||||||||||||||||||||||||||||||||||||||||||||||||||||||||||||||||
| - folder selection | ||||||||||||||||||||||||||||||||||||||||||||||||||||||||||||||||||||
| ResolveMacros | yes|no | Normally HostMonitor resolves macro variables specified in the script. However you may turn this option off at any time (and later turn it on again if you need). Command has effect for the following commands within the script (commands located below ResolveMacros line). For example this can be useful when you need to assign some macros for comment pattern. | ||||||||||||||||||||||||||||||||||||||||||||||||||||||||||||||||||
| SetCurrentFolder | <name of folder> | <full path> | Sets current folder, the following commands from this section (manipulation with tests) will work within specified folder. By default, HostMonitor uses the top folder including all subfolders (in other words, works will entire TestList). | ||||||||||||||||||||||||||||||||||||||||||||||||||||||||||||||||||
| IncludeSubfolders | yes|no | Defines either to perform operations for the current folder only or to use the folder and all descendant subfolders. By default, HostMonitor works with the specified folder and all descendant subfolders. | ||||||||||||||||||||||||||||||||||||||||||||||||||||||||||||||||||
| UseLinks | yes|no | Tells HostMonitor to perform (or does not perform) operations with test items that represented in the folder as links | ||||||||||||||||||||||||||||||||||||||||||||||||||||||||||||||||||
| - folder modification | ||||||||||||||||||||||||||||||||||||||||||||||||||||||||||||||||||||
| CreateFolder | <full path to the folder> |
Creates new folder(s). The value of this parameter should specify the full path to the folder that you want to create. E.g. CreateFolder Root\USA Branch\Support\part2\ will successively create 3 folders - "USA Branch" folder in the "Root" folder, - "Support" folder in "USA Branch" subfolder, - "part2" folder in "Support" subfolder. If some (or all) of specified folders already exist, HostMonitor will not create second copy of them. | ||||||||||||||||||||||||||||||||||||||||||||||||||||||||||||||||||
| SetFolderVariable | <variable_name> <variable_value> [-inheritpartly] |
Sets or modifies folder variable for current folder. If currently folder settings set to "inherit all variables from parent folder", this command will set "Use folder variables only" mode. Unless you specify optional -inheritpartly parameter; in such case HostMonitor will set "Use inherited variables; folder variables may override inherited variables" option. Note: if you are using folder-level variables as parameters of some test items, this command will modify test settings automatically. | ||||||||||||||||||||||||||||||||||||||||||||||||||||||||||||||||||
| SetFolderAgent | <fullpath>|<folderID> <agentname> [UnlessInherited] |
Sets Remote Monitoring Agent for specific folder. You may specify folder using full path or using folder ID; specify agent using its name. Optional "UnlessInherited" parameter tells HostMonitor to check agent used by parent folder and set (when possible) "Inherit agent from parent" option instead of changing folder-specific agent. If "UnlessInherited" is not specified then HostMonitor will set specified agent regardless of parent agent. | ||||||||||||||||||||||||||||||||||||||||||||||||||||||||||||||||||
|
Examples: CreateFolder Root\BackupOffice\WWW SetCurrentFolder Root\BackupOffice\WWW SetFolderVariable fvar_host "10.10.5.1" -inheritpartly SetFolderVariable fvar_e-mail admin_mike@gmail.com SetCurrentFolder Root\MainOffice\WWW SetFolderVariable fvar_host "10.10.1.1" SetFolderVariable fvar_e-mail admin_greg@gmail.com | ||||||||||||||||||||||||||||||||||||||||||||||||||||||||||||||||||||
| CopyFolder | [-r] <srcname>|<id>|<fullpath> <newname>|<newfullpath> |
Optional parameter "-r" tells HostMonitor to copy folder with its subfolders. Source folder can be specified by name (if this folder located within current parent folder - folder selected by SetCurrentFolder command); folder ID or full path to the folder. Target folder can be specified by name or full path. | ||||||||||||||||||||||||||||||||||||||||||||||||||||||||||||||||||
| CopyTest | <testname>|<groupname> <destfullpath>|<folderid> |
Copies specific test or group of tests (e.g. all Ping tests) into specified folder. Destination folder can be specified by full path or folder ID | ||||||||||||||||||||||||||||||||||||||||||||||||||||||||||||||||||
| CopyTestByID | <testid> <destfullpath>|<folderid> | Copies single test specified by ID into target folder specified by full path or folder ID | ||||||||||||||||||||||||||||||||||||||||||||||||||||||||||||||||||
| CopyAllTests | [-r] [-skipduplicates] [-adjustmasters] <destfullpath>|<folderid> |
Copies all test items from current folder (and optionally subfolders) into target folder "adjustmasters" option: if dependent tests copied with master(s) then HostMonitor adjust master-dependent relations for newly created tests. E.g. if you copy 6 tests (5 Cisco tests that depends on 1 Ping test) then new Cisco tests will depend on new Ping test (if you are using folder-related variables for target IP address, then new tests will start to monitor new device without any manual adjustments). | ||||||||||||||||||||||||||||||||||||||||||||||||||||||||||||||||||
| CopyIntoSelectedFolders | <testname>|<TestID> Below <fullpath>|<TopFolderID> When <expression> [-skipduplicates] |
This command allows you to copy specified test item into set of folders. You may select destination folders using logical expressions based on folder name or folder-level variables. First parameter (<test name> or <testID>) specifies what exactly test item should be copied. "Below <fullpath>" or "Below <TopFolderID>" parameter specifies target folders branch that should be used for operation. Then HostMonitor checks each folder and subfolder within specified branch, resolves folder-related macro variables, evaluates specified logical expression (When <expression> parameter) and copies the test item into folder when <expression> is true. For example, if you use "%folder%"=="Memory tests" expression, HostMonitor will copy test into each folder that named "Memory tests". If you use expression like "Important" in "%FolderComment%", HostMonitor will copy test into each folder that has word "Important" within folder comments. If you use expression "%fvar_testtype%" == "memory", HostMonitor will copy test into each folder that has %fvar_testtype% variable set to "memory" string. Last optional parameter (-skipduplicates) tells HostMonitor to skip operation for the folder when target folder already has test with the same name. Note: as usually HostMonitor will resolve folder-related variables that can be used as test parameters. This way single command can create set of tests for various servers. | ||||||||||||||||||||||||||||||||||||||||||||||||||||||||||||||||||
|
These commands allow you to create tests for new servers automatically in response to some event or copy tests using e-mail
message sent to HostMonitor. E.g. you may setup template items then use CopyFolder, SetFolderVariable, SetFolderAgent and
CopyAllTests commands to create complete set of tests for new server. Examples: CopyFolder -r Root\ServerTemplate Root\SQLServer2 SetCurrentFolder Root\SQLServer2 SetFolderVariable host 10.10.0.11 -inheritpartly SetFolderAgent Root\SQLServer2 "active 2" SetCurrentFolder Root\ServerTemplate CopyTests -r _AllPing Root\SQLServer2 CopyTests -r _AllODBC Root\SQLServer2 CopyTests -r _AllCPU Root\SQLServer2 SetCurrentFolder Root\SQLServer2 IncludeSubfolders yes EnableAllTests SetCurrentFolder Root\Templates CopyIntoSelectedFolders 555 Below "Root\" When "Disk" in "%folder%" -skipduplicates CopyIntoSelectedFolders "Top memory consumer" Below "Root\" When "%fvar_testtype%" == "memory" | ||||||||||||||||||||||||||||||||||||||||||||||||||||||||||||||||||||
| - manipulation with tests | ||||||||||||||||||||||||||||||||||||||||||||||||||||||||||||||||||||
| RefreshAll | Checks the status of all tests in the folder (except disabled hosts) immediately, do not wait for the elapse test interval for each test | |||||||||||||||||||||||||||||||||||||||||||||||||||||||||||||||||||
| ResetAll | Resets statistics for all tests within the folder | |||||||||||||||||||||||||||||||||||||||||||||||||||||||||||||||||||
| DisableAllTests | Disables all tests in the folder | |||||||||||||||||||||||||||||||||||||||||||||||||||||||||||||||||||
| EnableAllTests | Enables all tests in the folder | |||||||||||||||||||||||||||||||||||||||||||||||||||||||||||||||||||
| DisableTest | <TestName> | Disables the specified test | ||||||||||||||||||||||||||||||||||||||||||||||||||||||||||||||||||
| EnableTest | <TestName> | Enables the specified test | ||||||||||||||||||||||||||||||||||||||||||||||||||||||||||||||||||
| RefreshTest | <TestName> | Checks the status of the specified test immediately | ||||||||||||||||||||||||||||||||||||||||||||||||||||||||||||||||||
| ResetTest | <TestName> | Resets statistics for specified test or group of tests | ||||||||||||||||||||||||||||||||||||||||||||||||||||||||||||||||||
| PauseTest | <TestName> <interval> [<comment>] | Pauses specified test or group of tests (time interval should be specified in minutes, up to 1440 min). | ||||||||||||||||||||||||||||||||||||||||||||||||||||||||||||||||||
| ResumeTest | <TestName> | Resumes paused test or group of tests | ||||||||||||||||||||||||||||||||||||||||||||||||||||||||||||||||||
Note: instead specific TestName you can use following group names (remember, parameters are case sensitive):
  _AllGood
  _AllBad
  _AllUnknown
  _AllWarning


  _AllPing           _AllSMTP           _AllCPU
  _AllTrace          _AllPOP3           _AllMemory
  _AllTCP            _AllIMAP           _AllService
  _AllUDP            _AllEMail          _AllProcess
  _AllRAS            _AllMailRelay      _AllNTLog
  _AllNTP                               _AllPerfCounter
  _AllDNS            _AllURL            _AllDominantProcess
  _AllDHCP           _AllHTTP           _AllRegistry
  _AllLDAP           _AllSOAP           _AllWMI
  _AllRadius         _AllOPC            _AllHddSMART
  _AllDICOM          _AllCertificate    _AllDHCPPool
  _AllTraffic        _AllDomain         _AllFirewallStatus
  _AllNIS            _AllSIP            _AllAVStatus
                     _AllWebDavSpace    _AllLastUpdate

  _AllODBC           _AllFreeSpace      _AllVMHostStatus
  _AllOracle         _AllUNC            _AllVMHostCPU
  _AllPostgre        _AllFolderSize     _AllVMHostMemory
  _AllSybase         _AllFileExists     _AllVMHostDisk
  _AllInterbase      _AllFileContents   _AllVMStatus
  _AllMsSQL          _AllCountFiles     _AllVMCPU
  _AllMySQL          _AllTextLog        _AllVMDisk
                                        _AllVMMemory

  _AllSNMP           _AllExternalPrg    _AllHPHealth
  _AllSNMPTrap       _AllScript         _AllHPTemp
  _AllSNMPTable      _AllShell          _AllHPFans
  _AllTemp           _AllSSH            _AllHPPower
  _AllHMMonitor                         _AllHPDisks

  _AllCiscoHealth    _AllNetAppHealth   _AllJuniperHealth
  _AllCiscoTemp      _AllNetAppTemp     _AllJuniperTemp
  _AllCiscoFans      _AllNetAppDisks    _AllJuniperFans
  _AllCiscoPower

  _AllBigIPHealth    _AllNScalerTemp
  _AllBigIPTemp      _AllNScalerStats
  _AllBigIPStats

  _AllQnapHealth     _AllSynHealth
  _AllQnapTemp       _AllSynTemp
  _AllQnapFans       _AllSynDiskLoad

  _AllUPSHealth      _AllApache       _AllRMCPPing
  _AllUPSLoad        _AllNginx        _AllIPMIHealth
  _AllUPSCharge      _AllTomcat       _AllIPMITemp
  _AllUPSVoltageIn   _AllIIS          _AllIPMIFans
  _AllUPSVoltageOut                   _AllIPMIVoltage
  _AllUPSTemp                         _AllIPMICurrent
  _AllUPSTime                         _AllIPMIDiscrete

  _AllPrinterStatus
  _AllPrinterLevels
Examples:SetCurrentFolder Root IncludeSubfolders yes DisableTest _AllTCP EnableTest _AllPing RefreshTest _AllUnknown RefreshTest my router EnableTest server1 PauseTest server5 10 ResolveMacros no SetTestParam "Ping: www.nasa.gov" commentline01 %udv_admin_mail% | ||||||||||||||||||||||||||||||||||||||||||||||||||||||||||||||||||||
| SetTestParam | <TestName> <ParameterName> <Value> |
Sets parameters for the specified test or group of tests. ParameterName can be one of the following:
| ||||||||||||||||||||||||||||||||||||||||||||||||||||||||||||||||||
| ReplaceTestParam | <TestName> <ParameterName> <Curr. value> <New value> |
Replaces a value of a given parameter for the specified test or group of tests.
Unlike "SetTestParam" command, this one has a selective approach. It changes the value of a parameter
only for the tests that have a current value equal to the <Curr. value> argument
of the command. | ||||||||||||||||||||||||||||||||||||||||||||||||||||||||||||||||||
|
* Threshold (ThresholdUp) parameter can be used for the following tests: SetCurrentFolder Root\Asia\Ping tests IncludeSubFolders no SetTestParam _AllPing Timeout 2000 SetCurrentFolder Europe IncludeSubFolders yes SetTestParam _AllCPU UserName test1 SetTestParam _AllCPU Password pswd1 SetTestParam _AllRAS Comment admin ^M e-mail: admin@yahoo.com ^M phone: 567-9871 SetTestParam _AllRAS CommentLine02 address: 465 Whitefox Ave SetTestParam _AllRAS CommentLine03 phone: 567-9871 ReplaceTestParam _AllTCP timeout 2000 5000 SetTestParam _AllPing testinterval 5 SetTestParam _AllPing testinterval 00:02:30 ReplaceTestParam _AllCPU testinterval 5 00:15:00 SetTestParam "M. router" AlertProfile "E-mail to admin" SetTestParam _AllMemory usecommonlog yes SetTestParam _AllMemory unknownasbad no ReplaceTestParam _AllPing TestBy "hostmonitor" "folder-specific" ReplaceTestParam _AllCPU TestBy "hostmonitor" "agent - SouthWest domain" SetTestParam "main router" Threshold "50 %" SetTestParam "main router" Threshold2 "50 ms" SetTestParam _AllMemory Threshold "20 %" SetTestParam _AllTraffic Threshold "55 KB/sec" SetTestParam _AllTraffic Threshold "33 pkt/min" SetTestParam _AllTraffic Threshold "22 pkt" ReplaceTestParam _AllUPSTemp ThresholdUp 65 55 ReplaceTestParam _AllUPSTemp ThresholdDown 15 10 ReplaceTestParam _AllFreeSpace Threshold "20 %" "17 %" ReplaceTestParam _AllFreeSpace Threshold "5 GB" "8 GB" ReplaceTestParam _AllFreeSpace Threshold "6 GB" "15 %" SetTestParamByID 11054 Threshold "10 MB" | ||||||||||||||||||||||||||||||||||||||||||||||||||||||||||||||||||||
| AckTestStatus | <TestName> [For <minutes> | Till <ddmmyyyyhhnn>] [StopAlerts] [<Comment>] | Acknowledges failed test item(s) | ||||||||||||||||||||||||||||||||||||||||||||||||||||||||||||||||||
| ResetAcknowledgements | <TestName> | This command tells HostMonitor to clear "acknowledged" flag for specified test item(s) | ||||||||||||||||||||||||||||||||||||||||||||||||||||||||||||||||||
| ResetRecurrencesTest | <TestName> | Resets Recurrences counter to 0 for specified test. | ||||||||||||||||||||||||||||||||||||||||||||||||||||||||||||||||||
| ResetRecurrencesAll | Sets Recurrences counter to 0 for all tests in the folder. | |||||||||||||||||||||||||||||||||||||||||||||||||||||||||||||||||||
| ResetEventLogRefPoint | <TestName> |
This command resets internal counters of the NT Event Log test so that the next time when the test is performed
HostMonitor ignores all events that have happened before execution of this command. | ||||||||||||||||||||||||||||||||||||||||||||||||||||||||||||||||||
| note: the following commands work with specific test item(s) regardless of "setcurrentfolder" settings | ||||||||||||||||||||||||||||||||||||||||||||||||||||||||||||||||||||
| DisableTestByID | <TestID> | Disables test item specified by unique ID | ||||||||||||||||||||||||||||||||||||||||||||||||||||||||||||||||||
| EnableTestByID | <TestID> | Enables test item specified by unique ID | ||||||||||||||||||||||||||||||||||||||||||||||||||||||||||||||||||
| RefreshTestByID | <TestID> [forcelog] | Checks the status of the specified test immediately. Optional parameter "forcelog" tells HostMonitor to record test result into log file(s) regardless of logging mode and test result (effects just 1 test probe caused by "Refresh" command). In other words test result will be recorded even if you are using Brief logging mode and test status did not change. | ||||||||||||||||||||||||||||||||||||||||||||||||||||||||||||||||||
| RefreshIrregularTestByID | <TestID> [forcelog] | Command works similar to RefreshTestByID command - it tells HostMonitor to perform test probe immediately. In contrast to RefreshTestByID command, it can force execution even for test items that were configured with Irregular schedule | ||||||||||||||||||||||||||||||||||||||||||||||||||||||||||||||||||
| ResetTestByID | <TestID> | Resets statistics test item specified by unique ID | ||||||||||||||||||||||||||||||||||||||||||||||||||||||||||||||||||
| PauseTestByID | <TestID> <interval_minutes> [<Comment>] | Pauses test item specified by unique ID (up to 1440 min) | ||||||||||||||||||||||||||||||||||||||||||||||||||||||||||||||||||
| ResumeTestByID | <TestID> | Resumes paused test item | ||||||||||||||||||||||||||||||||||||||||||||||||||||||||||||||||||
| AckTestStatusbyID | <TestID> [For <minutes> | Till <ddmmyyyyhhnn>] [StopAlerts] [<Comment>] | Acknowledges failed test item(s) | ||||||||||||||||||||||||||||||||||||||||||||||||||||||||||||||||||
| ResetAcknowledgementsByID | <TestID> | This command tells HostMonitor to clear "acknowledged" flag for specified test item(s) | ||||||||||||||||||||||||||||||||||||||||||||||||||||||||||||||||||
| SetTestParamByID | <TestID> <ParameterName> <Value> | Similar to SetTestParam command, you just need to specify unique ID of the test instead of test name | ||||||||||||||||||||||||||||||||||||||||||||||||||||||||||||||||||
| ReplaceTestParamByID | <TestID> <ParameterName> <Curr. value> <New value> | Similar to ReplaceTestParam command, you just need to specify unique ID of the test instead of test name | ||||||||||||||||||||||||||||||||||||||||||||||||||||||||||||||||||
Examples:EnableTestByID 512 RefreshTestByID 614 PauseTestByID 716 10 "pause for 10 min" AckTestStatusByID 842 "comment" AckTestStatusByID 842 StopAlerts "comment 2" AckTestStatusByID 842 FOR 25 "comment 3" AckTestStatusByID 842 TILL 031220250544 SetTestParamByID 978 Comment admin ^M e-mail: admin@yahoo.com ^M phone: 567-9871 SetTestParamByID 179 CommentLine02 address: 465 Whitefox Ave ReplaceTestParamByID 282 timeout 2000 5000 SetTestParamByID 234 Schedule "Weekdays, 24 hours" | ||||||||||||||||||||||||||||||||||||||||||||||||||||||||||||||||||||
| - global variable commands | ||||||||||||||||||||||||||||||||||||||||||||||||||||||||||||||||||||
| SetUserVariable | <VariableName> <VariableValue> | Sets the value of a variable (if such variable does not exist, creates a new variable) | ||||||||||||||||||||||||||||||||||||||||||||||||||||||||||||||||||
| SaveUserVariables | Saves changes | |||||||||||||||||||||||||||||||||||||||||||||||||||||||||||||||||||
| LoadUserVariables | Loads previously saved variables | |||||||||||||||||||||||||||||||||||||||||||||||||||||||||||||||||||
| - other | ||||||||||||||||||||||||||||||||||||||||||||||||||||||||||||||||||||
| FlushCommonLog | Tells HostMonitor to record into common log current test statuses of all test items except items that do not use common log and items that already have recorded (today!) their status into common log | |||||||||||||||||||||||||||||||||||||||||||||||||||||||||||||||||||
| FlushPrivateLogs | Similar to FlushCommonLog but performs the same operation for all test items that
uses private log(s) These 2 commands can be useful for Log Analyzer in case when you are using Brief logging mode and for some reasons you do not want to use Midnight logging mode (e.g. you want to "flush" log records at noon instead of midnight or you want to "flush" log records for some specific private logs or you want to "flush" log records twice a day) | |||||||||||||||||||||||||||||||||||||||||||||||||||||||||||||||||||
| CreateReport | "report profile name" <target file name> | Generate the report to the specified file using specified report profile | ||||||||||||||||||||||||||||||||||||||||||||||||||||||||||||||||||
| StartProgram | <CommandLine> | Starts external program and continue to execute the script (do not wait until external program will terminate) | ||||||||||||||||||||||||||||||||||||||||||||||||||||||||||||||||||
| ExecuteProgram | <TimeToWait> <CommandLine> |
Executes external program, waits until external program is terminated, and continues to execute the script. If
parameter <TimeToWait> is not equal to 0, HostMonitor will "kill" the external application when the application is
not finished within the given timeout (time defined in milliseconds). Be careful with this command, HostMonitor stops monitoring when executes external program by this command. | ||||||||||||||||||||||||||||||||||||||||||||||||||||||||||||||||||
| EnableAlerts | Enable alerts | |||||||||||||||||||||||||||||||||||||||||||||||||||||||||||||||||||
| DisableAlerts | Disable all alerts (except "scheduled" actions). Note: if alerts are disabled then script can be launched manually (menu File->Execute script). Also you may setup built-in Scheduler to execute actions even when alerts are disabled. However if monitoring is stopped, Scheduler will be deactivated. | |||||||||||||||||||||||||||||||||||||||||||||||||||||||||||||||||||
| PauseAlerts | <interval> | Pause alerts for interval specified in minutes. In other words, all action profiles that usually were triggered by the change of test(s) status will not be executed within N minutes. All scheduled actions (those that are executed by built-in Scheduler) will continue to execute anyway. | ||||||||||||||||||||||||||||||||||||||||||||||||||||||||||||||||||
| PauseMonitor | <interval> | Pause monitoring for specified time (time should be specified in minutes) | ||||||||||||||||||||||||||||||||||||||||||||||||||||||||||||||||||
| StopMonitor | Stop monitoring | |||||||||||||||||||||||||||||||||||||||||||||||||||||||||||||||||||
| StartMonitor | Start monitoring | |||||||||||||||||||||||||||||||||||||||||||||||||||||||||||||||||||
| QuitMonitor | Quit HostMonitor | |||||||||||||||||||||||||||||||||||||||||||||||||||||||||||||||||||
You can find an example of HMS script in HostMonitor's directory 'Examples\', file script1.hms.
Multiline variables
Starting from HostMonitor version 9.00 multiline variables supported. E.g. you may use %MailBody% or %HttpPage% variables as body of
the script. This way you may setup HostMonitor to receive HM Script commands from mail server (see E-Mail test)
or from some page on your web server and execute these commands. In other words, you may send e-mail with HM Script commands to
HostMonitor and it will execute your e-mail.
E.g. you may setup HostMonitor to inform you about problems by e-mail and you may respond to HostMonitor by e-mail as well (e.g.
pause or acknowledge failed items). Even more, HostMonitor may send confirmation back to you (e.g. you may assign to E-Mail test
2 actions: "Execute HM script" action and "Send e-mail" action using %MailFrom% variable as recipient's address).
If there is some invalid command within such multiline variable, HostMonitor will record information into system log file (as usually).
Error description will tell you what exactly command within multiline variable is invalid and display 2 numbers (e.g.
line #1:2) where 1st number represents line within HM script file where variable specified;
2nd number represents line within variable where invalid command specified.
Note: for security reasons commands StartProgram and ExecuteProgram restricted for HM Scripts when such commands specified within
mail body, mail subject, HTTP page or HTTP header.
You may define parameters of StartProgram and ExecuteProgram commands using variables (e.g. StartProgram %MailSubj%),
in such case HostMonitor will start external application specified in your e-mail but we do NOT RECOMMEND
using such scripts for security reasons.
Also, please make sure you are using mail servers with secure connection!
When defining some of the alert action's parameters you can use special macro variables.
There are 6 groups of macro variables:
- variables that represent parameters of the same test that had triggered an action
- variables that represent parameters of some explicitly specified test
- variables that represent tests related to the same host
- folder-related variables
- HostMonitor status related macro variables
- user defined variables (also known as global macro variables)
- date & time variables
- Variables that represent parameters of the same test that had triggered an action
Macro variable Description Test properties %TestName% The name of the test. Has the same value as %HostName%, which has been retained for backward compatibility %HostName% Represents the name of the test (obsolete, retained for backward compatibility. Please, use %TestName% macro instead) %HostID% Represents all numbers in the name of the test. HostMonitor removes all characters from the test's name except decimal numbers and substitutes instead this macro. This macro can be useful when you need to send messages to numeric only pagers (beepers). %TestID% Represents unique ID of the test. TestID is always unique within an HML file %Agent% Represents a name of the remote agent that performs the test, this variable returns the string "HostMonitor" when the test is performed by HostMonitor %AgentAddr% This variable returns:
- "localhost" when test performed directly by HostMonitor;
- hostname or IP address specified for Passive RMA when test is performed by Passive agent;
- address of Active RMA system when Active agent is connected to HostMonitor;
- "0.0.0.0" when test should be performed by Active RMA but agent is not connected to HostMonitor.%TestMethod% Represents short description of a testing method %MethodID% Returns integer number that represents test method (test that has triggered action execution) Ping
TCP
URL
Disk free space
Folder size
File Availability
External
SSH
File Integrity
Oracle
UNC
Interbase
MS SQL
MySQL
PGSQL
Sybase
Process
Service
SNMP Get
NT Event Log
CPU Usage
File Compare
ODBC
SMTP
POP3
IMAP
DNS
LDAP0
1
2
3
4
5
6
7
8
9
10
11
12
13
14
15
16
17
18
19
20
21
22
23
24
25
26
27Trace
Count Files
RAS
Performance Counter
Active Script
UDP
NTP
Radius
HTTP
Text Log
Shell Script
Temperature Monitor
Network Traffic
SNMP Trap
WMI
Mail relay
DICOM
Dominant Process
DHCP
HM Monitor
SOAP/XML
E-Mail
Certificate expiration
Domain expiration
Registry
SNMP Table
Memory
VM Host Status28
29
30
31
32
33
34
35
36
37
38
39
40
41
42
43
44
45
46
47
48
49
50
51
52
53
54
55VM Host CPU
VM Host Memory
VM Host Disk
VM Guest Status
VM Guest CPU
VM Guest Memory
VM Guest Disk
OPC
SMART
Interface Status
ILO Health
ILO Temperature
ILO Fans
ILO Power
ILO Disks
Netapp Health
Netapp Temp
Netapp Disks
Cisco Health
Cisco Temp
Cisco Fans
Cisco Power
Junip Health
Junip Temp
Junip Fans
UPS Health
UPS Load
UPS Charged56
57
58
59
60
61
62
63
64
65
66
67
68
69
70
71
72
73
74
75
76
77
78
79
80
81
82
83UPS Volts In
UPS Volts Out
UPS Temp
UPS Time
Apache
Nginx
Tomcat
IIS
Synology Health
Synology Temp
Synology Load
Qnap Health
Qnap Temp
Qnap Fans
BIG_IP Health
BIG_IP Temp
BIG_IP Stats
Netscaler Temp
Netscaler Stats
WebDav
SIP84
85
86
87
88
89
90
91
92
93
94
95
96
97
98
99
100
101
102
103
104%TestedObjectInfo% Provides information about tested object, variable returns string value like 'MS SQL database "MainLog" on 192.168.10.15' or 'Win32 service "FAX" on 192.100.10.5'.
This variable offers more information than %TestMethod% variable%AccountSet% Returns username set for the test item (including URL, HTTP, OPC, SOAP, Mail Relay, Apache, NGINX, Tomcat, POP3, IMAP and other tests) %Interval% The time between two consecutive checks defined for the test (in hh:mm:ss format) %Interval_Sec%
%Interval_Min%Variables represent the period of time between two consecutive checks defined for the test in minutes and seconds correspondingly %ScheduleName% Name of a schedule assigned to the test %AlertProfile% Name of the action profile %AlertThreshold% Represents condition to set "Bad" status. E.g. for Drive Free Space test this macro will represent minimum limit of free space defined for the test; for TCP test it will display timeout; for CPU Usage test it will show maximum limit for CPU usage value.
%AlertThreshold% variable for Ping test may return values like:
50% lost; Timeout: 1000 ms - this format used when "jitter" option is not enabled
50% lost; Jitter: 100 ms - when both "lost" and "jitter" alert options used
Jitter: 100 ms - when only "jitter" alert option enabled%AlertThresholdValue% This variable works similar to %AlertThreshold% variable but it returns numeric value only (without any correspondent text comment).
E.g. %AlertThreshold% variable may return text like "Absent, MaxAge: 60" when it is used in action triggered by "File/Folder Availability" test method. In the same case %AlertThresholdValue% would return "60".
For Traffic Monitor test method it converts any units specified for test item threshold to Kbit/sec or pkt/sec units. If %AlertThreshold% returns "500 MB/sec" then %AlertThresholdValue% will return 4096000
For Ping test this variable returns timeout value or jitter threshold (if "Jitter" option enabled for the test)%MasterTest% Master test name %MasterTests% Returns list of master tests (items separated by CRLF characters). If test item depends on single master test or does not depend on any test, %MasterTests% and %MasterTest% variables are equivalent %DependantTestsName% If Master test triggers some actions, this variable provides short list of dependant items (shows test names) %DependantTestsPath% Similar to %DependantTestsName%, shows full path to dependant test items (including folder name).
Note: there is option that allows you to specify how many items should be displayed. This option is not accessible thru GUI however you may add line like MaxDependantItemsInMacro=10 into [Misc] section hostmon.ini file and restart HostMonitor (number of items should be in range 1..15; default value 5)%PrivateLog% The specified private log file name %RelatedURL% Related URL %TaskComment% Test's comment (whole comment, all lines separated by CRLF) %CommentLine1% Represents 1st line of test's comment %CommentLine2% Represents 2nd line of test's comment ... ... %CommentLine99% Represents 99th line of test's comment %CommentID% This macro is similar to %HostID%, but uses a test's comment instead the test's name. %CreatedTime% The time when the test was created %ModifiedTime% The time when the test was last modified Current test state %DATE% Current date %TIME% Current time %DateTime% Current date and time %LastTestTime% Time when the test was last performed %TestProbeTime% Test execution time in milliseconds %Reply% Represents reply value (depends on the test type, it can be reply time, disk's free space, message from NT Event Log, etc). HostMonitor may encode special characters in %Reply% variable. E.g. it replaces CRLF chars with \r\n when you are using variable for SQL Query; or replaces CRLF with <br> when you are using %Reply% variable for e-mail in HTML format (Send E-mail action) %Reply_DQuotes% Represents Reply field where single quotation marks replaced with double quotation marks %Reply_SQuotes% Represents Reply field where double quotation marks replaced with single quotation marks %Reply_CStyle% Represents Reply field with some characters replaced by special sequences conforming to C language standards:
- characters ASCII 13 (line feed) and ASCII 10 (new line) replaced with \r and \n correspondingly;
- characters ASCII 9 (tab) replaced with \t
- characters ASCII 39 (quotation mark) replaced with \'
- character ASCII 92 (back slash) replaced with \\
- and so on
this variable could be useful for writing Java scripts (e.g. for Custom HTML report) or SQL Query for ODBC log.%Reply_AsIS% HostMonitor may encode special characters in %Reply% variable. E.g. it replaces CRLF chars with \r\n when you are using variable for SQL Query; or replaces CRLF with <br> when you are using %Reply% variable for e-mail in HTML format (Send E-mail action).
For %Reply_AsIS% variable HostMonitor does not perform any special encoding.%Reply_Number% Represents actual numeric value of Reply field as a real number. E.g. for the Reply field containing '12.01 Kb', %Reply_Number% will return '12298.24'. It returns zero when the content of the field is a string that can not be converted into a number %Reply_Integer% Represents actual numeric value of reply field as an integer number. E.g. for the Reply field containing '12.01 Kb', %Reply_Integer% will return '12298'. It returns zero when the content of the field is a string that can not be converted into a number %Status% Status of the test (text) %StatusID% A 2 digits number that represents status of the test
00- Not tested
01- Host is alive
02- No answer
03- Unknown
04- Unknown host
05- Checking
06- Resolving
07- Ok
08- Bad
09- Disabled
10- Bad contents
11- Wait for Master
12- Out of schedule
13- Paused
14- Warning
15- Normal%SimpleStatus% This macro may return one of the following text values: - "UP" for good statuses (Host is Alive, Ok);
- "DOWN" for any bad status (No answer, Bad, Bad Contents); for Warning status when "Treat Warning as Bad" option is enabled; for Unknown status when "Treat Unknown as Bad" option is enabled
- "UNKNOWN" if status of the test is "Unknown" or "Unknown host" and "Treat Unknown as Bad" option is disabled; variable also returns "UNKNOWN" for statuses like WaitForMaster, OutOfSchedule, Paused
- "WARNING" when status of the test is "Warning" and "Treat Warning as Bad" option is disabled
%CurrentStatusIteration% The number of consecutive test probes resulting in the same status as the current one %Recurrences% Similar to %CurrentStatusIteration% but this counter is resetted by HostMonitor when test status changes from "bad" to "good", from "good" to unknown or warning and vice versa. While changes between "Ok", "Host is alive" and "Normal" statuses do not reset the counter, changes between "Bad" and "No answer" do not reset the counter either. "Threat Unknown status as Bad" and "Treat Warning status as Bad" options determine behaviour of the counter for Unknown and Warning statuses.
In other words: %CurrentStatusIteration% relates to %Status% while %Recurrences% relates to %SimpleStatus%
This is important counter, you probably will use this counter for "advanced" actions.%CurrentStatusDuration% Represents the duration of current (simple) status of the test, shows time interval in "[N days] HH:MM:SS" format %CurrentStatusDuration_sec% Represents the duration of current (simple) status of the test, shows time in seconds %FailureID% This variable allows you to use unique failure ID as parameter of the actions. HostMonitor assigns unique failure ID for each failed test and keeps the same ID when test fails several times in a row (note: "failure" conditions may depend on "Treat Unknown as Bad" or "Treat Warning as Bad" test properties). HostMonitor assigns different IDs for different test items; it assigns new unique ID when test restores "good" status and then fails again. HostMonitor sets %FailureID% variable to 0 when test has "good" status.
%LastFailureID% While %FailureID% variable represents unique failure ID for each current problem, %LastFailureID% returns ID of previous failure of the test.
%PauseComment% Represents comment specified for test item when operator paused test execution
The following variables may be used in the expressions that define Normal and Warning statuses (see Optional status processing section of the manual).
These variables may be used as parameters of some actions as well, but usually this does not have sense.%SuggestedStatus% Status that will be used for the test item, unless "normal" or "warning" options modify the status. Variable may return one of the following values: Host is alive, Ok, No answer, Bad, Bad contents, Unknown or Unknown host %SuggestedSimpleStatus% Similar to %SimpleStatus% but provides information about "suggested" status (test probe already responded with some result but %Status%, %Reply% and other regular counters not modified yet) %SuggestedReply% Represents "suggested" reply value ("Tune up reply" option allows you to change Reply value after test execution) %SuggestedReply_DQuotes% Represents "suggested" Reply value where single quotation marks replaced with double quotation marks %SuggestedReply_SQuotes% Represents "suggested" Reply value where double quotation marks replaced with single quotation marks %SuggestedReply_AsIS% HostMonitor may encode special characters in %SuggestedReply% variable. E.g. it replaces CRLF chars with \r\n when you are using variable for SQL Query; or replaces CRLF with <br> when you are using %Reply% variable for e-mail in HTML format (Send E-mail action).
For %SuggestedReply_AsIS% variable HostMonitor does not perform any special encoding.%SuggestedReply_Integer% Works similar to %Reply_Integer% variable but provides information about "suggested" reply value. E.g. if %SuggestedReply% shows '12.01 Kb', %SuggestedReply_Integer% will return '12298'. This variable returns zero when SuggestedReply is a string that can not be converted into a number %SuggestedLastReply% "Suggested" reply value returned by previous check %SuggestedRecurrences% Similar to %Recurrences% counter. Difference is HostMonitor sets this variable before Normal and Warning expressions processing. If you do not use optional status processing or both logical expressions return False, then %Recurrences% will be equivalent to %SuggestedRecurrences% %FailureIteration% The number of consecutive failed test probes. Shows 0 when test returns "good" result.
In contrast to other counters (like %Status%, %Recurrences%, %CurrentStatusIteration%, %FailedCnt%, etc) that depend on result of optional status processing (Normal and Warning expressions), this counter always tells you about REAL result of test probe. E.g. when test returns "bad" status, HostMonitor increments this variable even if "Use normal status..." option tells HostMonitor to change test status to Normal.
See processing sequence for detailsAcknowledgement %AcknowledgedAt% Represents the date and time when test status was acknowledged %AcknowledgedDate% Represents the date when test status was acknowledged %AcknowledgedTime% Represents the time when test status was acknowledged %AcknowledgedBy% Shows the name of the operator who have acknowledged the test status %AckComment% Shows the comment which was provided for "acknowledge" operation These 5 variables return empty string for non-acnowledged test items. %AckResponseTime% Shows time elapsed sinse test failure till status acknowledgement by operator.
This variable returns time in hh:mm:ss format; it may return empty string when test has Ok status; variable returns "Not acknowledged" string when test has Bad or Unknown not acknowledged status%AckRecurrences% Represents the number of test probes which have returned similar (bad or unknown) result after it was already acknowledged. Returns 0 for non-acknowledged test items.
For example if the test returned "bad" status during five consecutive probes, then %Recurrences% variable will be equal 5. If the user has acknowledged the bad status after the second probe then %AckRecurrences% will be equal 3 (5-2=3).
This variable is useful when you want to configure alert profile to launch different actions for "non-acknowledged" and "acknowledged" test items. E.g. if condition to trigger action execution looks like ('%SimpleStatus%'=='DOWN') and (%AckRecurrences%==1), HostMonitor will start action when user confirmed status and test failed once again (after acknowledgement).%AcknowledgedJustNow% Advanced mode action and variables like %AckRecurrences%, %AckComment% allow starting special actions when Bad test status was acknowledged by the operator. Such actions could be started after the following test probes while sometimes you may need to start action right after acknowledgment. If you set advanced mode action using %AcknowledgedJustNow% variable, then HostMonitor may trigger action when operator acknowledges test status without waiting for the next test probe. This way you may pause or disable test (if you need) right after acknowledgement and still trigger special action(s).
For example, you may use expressions like
%AcknowledgedJustNow% and ("%Reply%" > "90 %")
%AcknowledgedJustNow% and (("%AckComment%" getword 1)=="Attention")
Note: HostMonitor may trigger such action even if operator chooses "acknowledge and STOP alerts" option; "New ack comment" operation may trigger such alerts as well.Previous state To explain following variables we need to explain difference between terms "PreviousStatus" and "LastStatus". "PreviousStatus" is status which test had before current status. "LastStatus" is status which test had after previous check. For example for the last 5 probes test had following statuses: #1-Bad, #2-Unknown, #3-Ok, #4-Ok, #5-Ok (current status is #5-Ok). In this case "PreviousStatus" is #2-Unknown but "LastStatus" is #4-Ok. %LastStatus% Status of the test after previous check ("LastStatus") %LastSimpleStatus% Similar to %SimpleStatus% but provides information about last test status %LastReply% Reply value returned by previous check %LastReply_CStyle% Represents "Reply" value returned by previous check with some characters replaced by special sequences conforming to C language standards:
- characters ASCII 13 (line feed) and ASCII 10 (new line) replaced with \r and \n correspondingly;
- characters ASCII 9 (tab) replaced with \t
- characters ASCII 39 (quotation mark) replaced with \'
- character ASCII 92 (back slash) replaced with \\
- and so on
this variable could be useful for writing Java scripts (e.g. for Custom HTML report) or SQL Query for ODBC log.%LastReply_AsIS% HostMonitor may encode special characters in %LastReply% variable. E.g. it replaces CRLF chars with \r\n when you are using variable for SQL Query; or replaces CRLF with <br> when you are using %Reply% variable for e-mail in HTML format (Send E-mail action).
For %LastReply_AsIS% variable HostMonitor does not perform any special encoding.%PreviousStatus% The status, which the test had before last status change %PreviousStatusTime% Represents time when "PreviousStatus" was assigned to the test %PreviousStatusDuration% Represents the duration of the "PreviousStatus". Shows time interval in "[X days] HH:MM:SS" format. %PreviousStatusDuration_Sec% Represents the duration of the "PreviousStatus" in seconds. Statistical information %StatusChangedTime% The time when the status last changed %StatusChangesCnt% The number of times the status has changed %TotalTests% Overall tests performed %TotalTime% The time the test has been in monitoring %FailedCnt% The number of "Bad" tests %PassedCnt% The number of "Good" tests %UnknownCnt% The number of "Unknown" tests %AliveTime% The overall time the test has had a "Good" status %DeadTime% The overall time the test has had a "Bad" status %UnknownTime% The overall time the test has had an "Unknown" status %AliveRatio% "Good" to overall tests ratio, in percent %DeadRatio% "Bad" to overall tests ratio, in percent %UnknownRatio% "Unknown" to overall tests ratio, in percent %AverageReply% The average value of the results obtained %MinReply% The minimum value of the results obtained %MaxReply% The maximum value of the results obtained
Note: If you are using %AverageReply%, %MinReply% or %MaxReply% variables for Custom HTML Report or HTML e-mail template, HostMonitor will use "human readable" format. E.g. if variable value is '10485760', HostMonitor will show '10 GB' instead.
Another 72 new variables provide access to additional test statistics when "Store historical data in the file" option is enabled. You may get min/max/average reply and alive/dead/unknown ratio for several time intervals.
These variables can be used for Custom HTML Report templates; also you may create new Views and use these Views for any kind of reports. For example you may create SLA report with test items that show degradation in performance (this week is worse than previous week) using "Select items using expression" option with simple expression: %StatThisWeek_AliveRatio% < %StatLASTWeek_AliveRatio%Today's test results Yesterday's results %StatTODAY_MinReply% %StatYESTERDAY_MinReply% %StatTODAY_MaxReply% %StatYESTERDAY_MaxReply% %StatTODAY_AverageReply% %StatYESTERDAY_AverageReply% %StatTODAY_AliveRatio% %StatYESTERDAY_AliveRatio% %StatTODAY_DeadRatio% %StatYESTERDAY_DeadRatio% %StatTODAY_UnknownRatio% %StatYESTERDAY_UnknownRatio% Results for last 24 hours Results for last 48 hours %Stat24Hours_MinReply% %Stat48Hours_MinReply% %Stat24Hours_MaxReply% %Stat48Hours_MaxReply% %Stat24Hours_AverageReply% %Stat48Hours_AverageReply% %Stat24Hours_AliveRatio% %Stat48Hours_AliveRatio% %Stat24Hours_DeadRatio% %Stat48Hours_DeadRatio% %Stat24Hours_UnknownRatio% %Stat48Hours_UnknownRatio% Results for current week Results for last week %StatThisWeek_MinReply% %StatLASTWeek_MinReply% %StatThisWeek_MaxReply% %StatLASTWeek_MaxReply% %StatThisWeek_AverageReply% %StatLASTWeek_AverageReply% %StatThisWeek_AliveRatio% %StatLASTWeek_AliveRatio% %StatThisWeek_DeadRatio% %StatLASTWeek_DeadRatio% %StatThisWeek_UnknownRatio% %StatLASTWeek_UnknownRatio% Results for last 7 days Results for last 14 days %Stat7Days_MinReply% %Stat14Days_MinReply% %Stat7Days_MaxReply% %Stat14Days_MaxReply% %Stat7Days_AverageReply% %Stat14Days_AverageReply% %Stat7Days_AliveRatio% %Stat14Days_AliveRatio% %Stat7Days_DeadRatio% %Stat14Days_DeadRatio% %Stat7Days_UnknownRatio% %Stat14Days_UnknownRatio% Results for last 30 days Results for last 60 days %Stat30Days_MinReply% %Stat60Days_MinReply% %Stat30Days_MaxReply% %Stat60Days_MaxReply% %Stat30Days_AverageReply% %Stat60Days_AverageReply% %Stat30Days_AliveRatio% %Stat60Days_AliveRatio% %Stat30Days_DeadRatio% %Stat60Days_DeadRatio% %Stat30Days_UnknownRatio% %Stat60Days_UnknownRatio% Results for current month Results for last month %StatThisMonth_MinReply% %StatLASTMonth_MinReply% %StatThisMonth_MaxReply% %StatLASTMonth_MaxReply% %StatThisMonth_AverageReply% %StatLASTMonth_AverageReply% %StatThisMonth_AliveRatio% %StatLASTMonth_AliveRatio% %StatThisMonth_DeadRatio% %StatLASTMonth_DeadRatio% %StatThisMonth_UnknownRatio% %StatLASTMonth_UnknownRatio%
Macro variables specific to test method
%HostAddr% Represents the host name (or IP address) of the target system for the following tests: Ping, TCP, URL, HTTP, Oracle, Interbase, MS SQL, MySQL, Sybase, Postgre, Process, Service, NT Log, CPU Usage, SNMP, SMTP, POP, IMAP, DNS, DHCP, LDAP, UDP, NTP, RADIUS, UNC, Drive Free Space, Temperature Monitor, Traffic Monitor, Dominant Process, Performance Counter, WMI and Mail Relay.
Also it can be used in actions triggered by file related test methods: Count Files, Text Log, Compare Files, File Integrity, Folder/File Size, File/Folder Availability and Disk Free Space. When you are using this variable for action assigned to file related test method, HostMonitor analyzes path to target file and returns name of target server or "localhost" when test item checks local file. Note: if you setup test using path to mapped network drive (instead of using UNC path), this variable will return "localhost".%HostAddrB% Variable works similar to %HostAddr% variable, it returns host name without back slashes. E.g. if path to the file specified as \\sqlserver5\shareddisk1\file5 then %HostAddr% will return \\sqlserver5 while %HostAddrB% will return sqlserver5
%IP4% IP address of the host checked by the test item (also %ip% variable can be used).
"Normally" IP address is not applicable for some test methods: RAS, SNMP Trap, ODBC, External, Active Script and Shell Script.
However when you add new test item using Network Map window, HostMonitor sets fixed IP address (address of the selected host) to such tests. This allows to link External/Script/ODBC tests to specific host on the map. Also Network Map offers 2 menu items for such tests:
- Set fixed IP
- Clear fixed IP
For other tests IP address can be discovered by HostMonitor or Remote Monitoring Agent ()even if you provide hostname as target host)%TestTimeout% Represents timeout specified for test item, in milliseconds. If timeout is not specified or not applicable, variable returns 0 the following variables have sense for Ping test items %Jitter% Amount of variation in response time, in milliseconds
Note: when you setup Ping test with "Alert if Jitter.." option disabled and "Lost ratio" option set to 100% and you are not using Lost, Received or Jitter display option then HostMonitor (or RMA) will wait for SINGLE received ICMP packet and %Jitter% variable will be set to -1 (unused)%LostRatio% Ratio of lost packets to total transmitted packets the following variable has sense for TCP and UDP test items, for other tests this macro returns an empty string %ServerReply% Represents data received from tested server (limited to first 512 bytes). Non-printable characters represented by sequences formatted %XX where XX is a hexadecimal code of a character (byte). If TCP test was not configured to check reply from the server (check TCP connection only), variable will return empty string. the following variables have sense for "Service" test only, for other tests these macros return an empty string %ServiceComp% The name of the target computer %ServiceName% The name of the service the following variables have sense for "Trace" test only, for other tests these macros return an empty string %TraceBrief% Route to the host. Contains IP addresses only %TraceFull% Route to the host. Contains hop number, IP address, and reply time for each hop %TraceSlowestNode% Position of the slowest node in the route %TraceSlowestHost% IP address of the slowest host in the route %TraceSlowestTime% Response time of the slowest host in the route %TraceLastNode% Position of the last responsive host in the route %TraceLastHost% IP address of the last responsive host in the route %TraceLastTime% Response time of the last responsive host in the route the following variables have sense for "URL", "HTTP", "SOAP" and "SIP" tests only, for other tests these macros return an empty string %HostURL% Represents URL used for the test %HttpCode% HTTP status code received from the server. Also this variable may return winsock error codes in case web server is not accessible (e.g. you have specified incorrect server name) %HttpHeader% Complete HTTP header received from the server %HttpPage% Represents contents of the monitored web page (first 32768 (32K) characters of the web page if test was performed by HostMonitor; first 2048 (2K) characters of the page if test was performed by RMA).
Variable may be empty if you setup URL test item to check HTTP response only, without checking content or CRC of the page. HTTP test returns an empty string if a HEADER request is used. It also returns an empty string when a monitored web server does not respond.the following variables provide information about the results of DNS tests %DnsResults% Provides information about all entities received from DNS server (items separated by CRLF characters) %DnsResult% Provides information about 1st entity only variables for Certificate Expiration test method %CertIssuer% Shows information about the certificate issuer %CertSubject% Shows information about the certificate subject %CertIssuerShort% Short information about the certificate issuer %CertSubjectShort% Short information about the certificate subject %CertValidFrom% Shows the date that the certificate issuer specified as the start date for the certificate %CertValidTill% Shows expiration date for the certificate variables for Domain Expiration test method %DomainName% Domain name specified for the test %DomainExpirationDate% Expiration date for specified domain variables for E-Mail test method %MailFROM% Represents address of the sender %MailTO% Represents recipient address %MailSUBJ% Shows e-mail subject %MailBODY% Returns e-mail body (up to 16KB) %MailBodyNoQuotes% Content of the mail (up to 16KB) without the following characters: ' " [ ] %MailLine1% Represents 1st line of e-mail body %MailLine2% Represents 2nd line of e-mail body ... ... %MailLine99% Represents 99th line of e-mail body variables for ODBC Query test method %ODBCField1% Value of 1st specified field %ODBCField2% Value of 2nd specified field the following variables have sense for "Drive Free Space" test only, providing information about drive with smallest amount of free space (or drive with minimal percentage of free space when "%" alert options is selected): %DiskID% Drive ID (e.g. C:) %DiskLabel% Drive label %DiskSize% Capacity of the drive %DiskFreeSize% Amount of free space %DiskFreePercent% Percentage of free space the following variables have sense for "HDD SMART" test only, providing information retrieved from the selected hard disk %Disk_Name% Name of the selected disk %Disk_Temp% Current hard disk temperature (Celsius) %Disk_Hours% Count of hours in power-on state. On some disks manufactured before 2005 this value may advance erratically and/or reset to zero periodically %Disk_Relocated% Count of reallocated sectors represents a count of the bad sectors that have been found and remapped %Disk_Pending% Count of "unstable" sectors waiting to be remapped %Disk_Uncorrectable% The total count of uncorrectable errors when reading/writing a sector. A rise in the value of this attribute indicates defects of the disk surface and/or problems in the mechanical subsystem %Disk_SpinupTime% Average time of spindle spin up from 0 RPM to fully operational speed (milliseconds) %Disk_SpinupRetries% Count of retry of spin start attempts. This attribute stores a total count of the spin start attempts to reach the fully operational speed (under the condition that the first attempt was unsuccessful). An increase of this attribute value is a sign of problems in the hard disk mechanical subsystem %Disk_ErrorRate% The rate of hardware read errors that occurred when reading data from a disk surface. The value has different structure for different vendors %Disk_Timeouts% The count of aborted operations due to hard disk timeout %Disk_AlertReason% ID of the counter that triggered "bad" status for the disk, e.g. 194 for critical temperature; 198 for uncorrectable errors out of range (0 when all disks are healthy) %Disk_AlertValue% Current value of the counter that triggered "bad" status for the disk the following variables provide information about the file detected by Folder/File Availability test method or the file processed by other file-related test methods (Text Log, Folder/File Size and Compare Files).
Note: These variables provide information about file when tests performed by HostMonitor directly or tests performed by Passive or Active RMA for Windows. Variables return empty string when tests performed by RMA for UNIX%FileName% Name of the file. Useful when you setup the test using wildcards or variables in "filename" field.
This variable can be used for File/Folder Availability, Text Log, Folder/File Size and Compare Files test methods.%FilePath% Full path without filemask (Count Files and Folder/File Size tests only).
Folder/File Size test: if test checks folder specified without trailing slash, variable will return parent folder path%FileSize% Size of the file (Folder/File Availability test method only) %FileTime% Modification time (Folder/File Availability test method only) %FileAge_Min% File age in minutes (Folder/File Availability test method only) %FileAge_Hour% File age in hours (Folder/File Availability test method only) %FileAge_Day% File age in days (Folder/File Availability test method only) %FileName2% Shows name of the 2nd file (if specified) for Compare Files test method. Useful when you are using variables or wildcards in filename (instead of static name) the following variables have sense for "NT Event Log" test only, they represent parameters of the last "Bad" event detected: %NTEventSource% Event source. Identifies the software that logged the event %NTEventComp% Name of the computer where the event occurred %NTEventTime% Time of the event %NTEventType% Type of the event (number) %NTEventTypeName% Type of the event (string, like 'Error', 'Warning', 'Success audit', etc) %NTEventID% Event identifier %NTEventUser% Represents the user name if an event is attributed to a specific user %NTEventText% Event description %NTEventTextNoQuotes% Event description, text string without the following characters: ' " [ ] CR LF (useful for optional status processing or advanced mode actions) the following variables provide information about previous detected event: %PrevNTEventSource% Event source. Identifies the software that logged the event %PrevNTEventComp% Name of the computer where the event occurred %PrevNTEventTime% Time of the event %PrevNTEventType% Type of the event %PrevNTEventID% Event identifier %PrevNTEventUser% Provides user name if the event is attributed to a specific user %PrevNTEventTextNoQuotes% Event description, text string without the following characters: ' " [ ] CR LF (useful for optional status processing or advanced mode actions) the following variables provide number of new events when test set with "Report about last event but count ALL" option %NTEvents_BadCnt% Number of new "bad" events %NTEvents_GoodCnt% Number of new "good" events the following variables provide information about the process detected by Dominant Process test method %ProcessName% Name of the process %ProcessID% PID (process ID or process identifier) %ProcessOwner% Owner of the process (account name) the following variables provide information about firewall settings detected by Firewall Status test method %Firewall_StatusStr% Firewall status string like "dom=111uuuuu pub=11101110 std=11uuuuuu" %Firewall_ReasonStr% Reason for "Bad" test status, like "LogDroppedPackets disabled (domain profile)" the following variables provide information about detected host or guest system (e.g. guest OS with lowest amount of free memory or system with highest CPU usage). VM system group of tests %VMName% guest name %VMCPUusage% CPU usage (%) %VMFreeMem% free memory (%) %VMVolume% disk volume name (applicable for VM Ware systems only) %VMFreeDisk% disk free space (%) (applicable for VM Ware systems only) the following variables provide information about network interfaces checked by Interfaces Status test method %InterfacesDOWN_Index% List of interfaces indexes which status not UP (separated by commas) %InterfacesDOWN_Name% List of interfaces descriptions which status not UP, separated by CRLF %InterfacesChanged_Index% List of interfaces indexes which status has been changed (separated by commas) %InterfacesChanged_Name% List of interfaces descriptions which status has been changed (separated by CRLF) the following variables supported by NetApp Health test method %DS_MaxUsedPercent% The percentage of space currently in use or reserved by the fullest file system %DS_MaxUsedINodesPercent% The percentage of inodes currently in use by the fullest file system the following variables supported by NetApp RAID test method %DS_ActiveCount% The number of disks which are currently active, including parity disks %DS_ReconstructingCount% The number of disks which are currently being reconstructed %DS_ReconstrparityCount% The number of parity disks which are currently being reconstructed %DS_VerifyingparityCount% The number of parity disks which are currently being verified %DS_ScrubbingCount% The number of parity disks which are currently being scrubbed %DS_FailedCount% The number of disks which are currently broken %DS_SpareCount% The number of available spare disks %DS_AddingSpareCount% The number of spare disks which are currently being added into a RAID group %DS_PrefailedCount% The number of prefailed disks marked for rapid raid recovery %DS_OutdatedCount% The number of outdated disks the following variables supported by HP iLO tests (Health, Temp, Fans, Power, Disks) %HealthData% If some problem detected, shows problem description like "STORAGE STATUS: Degraded";
otherwise reports status of all checked components, e.g.
BIOS HARDWARE: OK
POWER SUPPLIES: OK
PROCESSOR: OK
FANS: OKthe following variable applicable for Printer Status and Printer Supply Levels tests %PrinterDetails% Printer Status test: name of the printer, description, location and information about the problem(s). %PrinterDetails% Printer Supply Levels test: name of the printer, description, location and information about all avilable supplies. The following variables applicable for "SNMP Trap" test only, they represent parameters of the last filtered message (filtered message is the one that have passed all conditions of the test item filter). When HostMonitor launches action in response to received trap message, it substitutes macro variable with its value pertinent to the trap message being received. %TrapHost% Represents IP address of the host that have sent the message %TrapHostInfo% If you have specified host name or description in HOSTINFO.LST file, HostMonitor will get information from the file and replace IP address with appropriate description. See HOSTINFO.LST file for details (it's a text file) %TrapCommunity% Community string %TrapType% Represents type of the trap. It provides information about generic type and enterprise specific number. Generic type could be one of the following: Cold Start, Warm Start, Link Down, Link Up, Auth Failure, EGP Loss and Specific. Enterprise specific number is only applicable when generic trap type is Enterprise Specific, otherwise enterprise specific number is 0 %TimeTicks% Represents time ticks. Time ticks is the time interval (measured in hundredth of seconds) since the initialization (boot, start-up) of the entity that have sent the trap. %Enterprise% Enterprise field contains an OBJECT IDENTIFIER which names the device that sends the trap %EnterpriseName% Using the database of compiled MIB files HostMonitor may translate Enterprise OID from its numeric form to a MIB name. If you need to extend the database, include information about MIBs supported by some specific SNMP enabled device, use MIB Browser %EnterpriseNameShort% Similar to %EnterpriseName% but shows the name without names of parent nodes.
E.g.- %Enterprise% = 1.3.6.1.4.1.3955.5
- %EnterpriseName% = iso.org.dod.internet.private.enterprises.linksys.etherHub
- %EnterpriseNameShort% = etherHub
%EnterpriseDescription% Object description (defined within MIB file) Each trap message may contain one or several variables that provide information about the event. Following macro variables allow you to access that information: %MibOid% Represents OID (object identifier) of the variable %MibName% Using the database of compiled MIB files HostMonitor may translate %MibOID% from its numeric form to a MIB name. If you need to extend the database by including information about MIBs supported by some specific SNMP enabled device, use MIB Browser %MibNameShort% Similar to %MibName% but shows the name of the variable (plus possible index) without names of parent nodes.
E.g.- %MibOID% = .1.3.6.1.2.1.2.2.1.8.1
- %MibName% = iso.org.dod.internet.mgmt.mib-2.interfaces.ifTable.ifEntry.ifOperStatus.1
- %MibNameShort% = ifOperStatus.1
%MibDescription% Description of the variable (defined within MIB file) %MibType% Type of the variable %MibValue% Variable value %MibRelative% Relative value of the variable. This macro is applicable when you check incoming trap messages for some specific variable and compare current value of the variable with its previous value (see "Message contains OID" option in the Trap Filter dialog).
%MibRelative% may represent:- simple difference between current and previous value (if you use "increases by", "decreases by" or "changes by" compare option)
- relative difference as a percentage of previous value (if you use "increases by (%)", "decreases by (%)" or "changes by (%)" compare option)
- average increase/decrease of the counter per second since previous message (if you use "increases /sec", "decreases /sec" or "changes /sec" compare option)
%OidVal.1.2.3.5.204.0% Such macro returns value of the specified variable (OID 1.2.3.5.204.0) received within SNMP Trap message. Use any valid OID instead of 1.2.3.5.204.0 %TrapAllValues% This macro returns information about ALL variables received within Trap message (%TrapAllValues% returns "oid=value" line(s); if there is more than 1 variable in SNMP Trap message, lines will be separated by #13#10 characters).
Note: %MibOid%, %MibName%, %MibType%, %MibValue% variables provide the information about specific OID variable (if you have set "Message contains OID" option of the test filter) or the information about 1st variable within SNMP Trap packet.%TrapAllValues_Name% Using the database of compiled MIB files HostMonitor may translate Object Identifiers (OIDs) provided by %MibAllValues% variable from its numeric form to a MIB nameþ If you need to extend the database by including information about MIBs supported by some specific SNMP enabled device, use MIB Browser. %TrapAllValues_NameShort% Similar to %TrapAllValues_Name% but shows the name of the variable (plus possible index) without names of parent nodes.
E.g.
if %TrapAllValues% returns
1.3.6.1.2.1.2.2.1.7.1 = 1
1.3.6.1.2.1.2.2.1.2.1.8.1 = 1
then %TrapAllValues_Name% will show
iso.org.dod.internet.mgmt.mib-2.interfaces.ifTable.ifEntry.ifAdminStatus.1 = 1
iso.org.dod.internet.mgmt.mib-2.interfaces.ifTable.ifEntry.ifOperStatus.1 = 1
and %TrapAllValues_NameShort% will return
ifEntry.ifAdminStatus.1 = 1
ifEntry.ifOperStatus.1 = 1%TrapAllValues_NameValue% Similar to %TrapAllValues_Name% while translates not only OID but also its value from numeric form to a MIB name (if value represents some object identifier as well). %TrapAllValues_NameValueShort% Similar to %TrapAllValues_NameShort%, translates every OID and its value from its numeric form to a MIB name.(if value represents some object identifier as well). There is option that allows you to specify how many words (not including trailing numbers that could not be resolved to name) should be displayed by the following macro variables:
%EnterpriseNameShort%,
%MibNameShort%,
%TrapAllValues_NameShort%,
%TrapAllValues_NameValueShort%.
This option is not accessible thru GUI however you may add line like snmpShortMibNameLen=3 into [Misc] section hostmon.ini file and restart HostMonitor.The following variables applicable for "HM Monitor" test only, they provide information related to HostMonitor requested by the test item %HMVersionText% Version of HostMonitor, like HostMonitor v. 8.12 %HMVersionBin% Binary version, like 0812 %HMSystemName% Name of the system where HostMonitor is running %HMStartedTime% Date and time when HostMonitor was started %HMTestItemsCnt% How many test items are in use (including disabled and paused items) %HMTestsDone% Number of tests performed by tested HostMonitor (since previous test execution). Returns 0 if request failed %HMTestsFailed% Number of "failed' test probes performed by HostMonitor (since previous test execution). Returns 0 if request failed %HMActionsDone% Number of actions executed by HostMonitor (since previous test execution). Returns 0 if request failed %HMLogsDone% Number of log records added by tested HostMonitor (since previous test execution). Returns 0 if request failed %HMTestsPerSec% Average "tests per second" rate for tested HostMonitor since previous test execution %HMActionsPerSec% Average "actions per second" rate for tested HostMonitor since previous test execution %HMLogsPerSec% Average "log records per second" rate for tested HostMonitor since previous test execution %HMActionsATC% Actions ATC (Average Time Consumption). Time used by tested HostMonitor for actions (milliseconds per action). This time does not include time used by auxiliary threads, its not so important %HMLogsATC% Logging ATC (Average Time Consumption). Time used by tested HostMonitor for logging (milliseconds per record). This time does not include time used by auxiliary threads, its not so important. This option can be useful for investigation of some 3rd party software related problems (e.g. if ODBC driver specified for ODBC logging consumes too much time) %HMLoggingPoolUsage% Current logging pool usage (percentage). High value of this counter means logging performance is too low for your testlist %HMStatusString% String that represent status of target HostMonitor, like the following
- monitoring started, alerts enabled, modifications stored
- monitoring stopped, alerts disabled, modifications not stored
If test failed (e.g. HostMonitor does not respond), this variable returns 'request failed' stringMacro variables that allow you to use remote site time as parameters of the actions.
Note 1: We do not recommend using %*_RemoteSite% variables as parameters of SQL query used for ODBC logging unless you are using separate database tables for each folder with unique time settings.
Note 2: You may use %Date%, %Time%, %DateTime%, %LastTestTime% and other variables that utilizes local system time settings and the following variables that represent remote site time in the same action profile. This allows you to setup different actions for local administrators and for staff that works at remote site.%GMTOffset_Local% GMT offset (time zone) specified on local system %GMTOffset_RemoteSite% GMT offset (time zone) on remote site %Date_RemoteSite% Current date on remote site (shows the date using the format given by the ShortDateFormat Windows variable) %Time_RemoteSite% Current time on remote site (displays the time using the format given by the LongTimeFormat Windows variable) %DateTime_RemoteSite% Current date and time on remote site %LastTestTime_RemoteSite% Time when the test was last performed %StatusChangedTime_RemoteSite% The time when the status was last changed %PreviousStatusTime_RemoteSite% Represents time when "PreviousStatus" was assigned to the test %AcknowledgedAt_RemoteSite% Represents the date and time when test status was acknowledged %AcknowledgedDate_RemoteSite% Represents the date when test status was acknowledged %AcknowledgedTime_RemoteSite% Represents the time when test status was acknowledged %CreatedTime_RemoteSite% The time when the test was created %ModifiedTime_RemoteSite% The time when the test was last modified
Variables for SNMP Table test method (these variables can be used as parameters of actions assigned to SNMP Table test items)%SNMPTable% Shows entire table retrieved from SNMP agent, each row displays <oid> = <value> pair.
E.g.- 1.3.6.1.2.1.2.2.1.2.1 = MS TCP Loopback interface
- 1.3.6.1.2.1.2.2.1.2.2 = Broadcom NetLink Gigabit Ethernet
%SNMPTable_Name% Shows table retrieved from SNMP agent, MIB name is displayed instead of OID.
E.g.- iso.org.dod.internet.mgmt.mib-2.interfaces.ifTable.ifEntry.ifDescr.1 = MS TCP Loopback interface
- iso.org.dod.internet.mgmt.mib-2.interfaces.ifTable.ifEntry.ifDescr.2 = Broadcom NetLink Gigabit Ethernet
%SNMPTable_NameShort% Similar to %SNMPTable_Name% but HostMonitor shows the name of SNMP counter (plus index) without names of all parent nodes.
E.g.- ifTable.ifEntry.ifDescr.1 = MS TCP Loopback interface
- ifTable.ifEntry.ifDescr.2 = Broadcom NetLink Gigabit Ethernet
%SNMPTable_VALUES% Values without OID
E.g.- MS TCP Loopback interface
- Broadcom NetLink Gigabit Ethernet
%LastSNMPTable% Shows SNMP table retrieved by previous test probe, each row displays <oid> = <value> pair %LastSNMPTable_Name% Shows table retrieved by previous test probe, MIB name is displayed instead of OID %LastSNMPTable_NameShort% Similar to %LastSNMPTable_Name% but HostMonitor shows the name of SNMP counter (plus index) without names of all parent nodes %LastSNMPTable_VALUES% Values without OID
If "Apply filter" test property is enabled, HostMonitor may skip some items from the table (e.g. you may skip all network interfaces with zero incoming traffic). The following variables allow you to retrieve SNMP table without showing these items%SNMPFilteredTable% Shows table retrieved from SNMP agent (only items that passed filter), each row displays <oid> = <value> pair. %SNMPFilteredTable_Name% Shows table retrieved by test probe (items that passed filter), MIB name is displayed instead of OID %SNMPFilteredTable_NameShort% Similar to %SNMPFilteredTable_Name% but HostMonitor shows the name of SNMP counter (plus index) without names of all parent nodes. %SNMPFilteredTable_Values% Values without OID %LastSNMPFilteredTable% Shows table retrieved by previous test probe (only items that passed filter) %LastSNMPFilteredTable_Name% Shows table retrieved by previous test probe (items that passed filter), MIB name is displayed instead of OID %LastSNMPFilteredTable_NameShort% Similar to %LastSNMPFilteredTable_Name% but HostMonitor shows the name of SNMP counter (plus index) without names of all parent nodes. %LastSNMPFilteredTable_Values% Values without OID %SNMPFilteredPattern% Shows string like 11010011 where 1 means row of the table passed filter; 0 means row was skipped (such rows are not displayed by %SNMPFiltered*% variables). %LastSNMPFilteredPattern% Similar to %SNMPFilteredPattern% variable, shows information about passed and skipped values retrieved by previous test probe. %SNMPTableDiff% This variable shows only counters that were changed since previous test probe.
E.g.- 1.3.6.1.2.1.2.2.1.10.1 = 2316972916 (previously 2316956889)
- 1.3.6.1.2.1.2.2.1.10.5 = 2252070440 (previously 2252065336)
%SNMPTableDiff_Name% Similar to %SNMPTableDiff% but MIB name is displayed instead of OID.
Using the database of compiled MIB files HostMonitor may translate Object Identifiers (OIDs) from its numeric form to a MIB name. If you need to extend the database by including information about MIBs supported by some specific SNMP enabled device, use MIB Browser.%SNMPTableDiff_NameShort% Similar to %SNMPTableDiff_Name% but HostMonitor shows the name of SNMP counter (plus index) without names of all parent nodes. Note: There is option that allows you to specify how many words (not including trailing indexes that could not be resolved to name) should be displayed by %SNMPTable_NameShort%, %LastSNMPFilteredTable_NameShort% and %SNMPTableDiff_NameShort% variables. This option is not accessible thru GUI however you may add line like snmpShortMibNameLen=3 into [Misc] section hostmon.ini file and restart HostMonitor.
The following variables provide HTML code that can be used in your HTML reports or HTML e-mails.%SNMPFilteredTable_HTML% Shows table with filtered counters (or table with all counters when "Apply filter" option is disabled). For each counter HostMonitor provides the following information: - OID and short name
- Value
- Previous value
- Difference
- Difference percentage wise
%SNMPTableDiff_HTML% Similar to %SNMPFilteredTable_HTML% but this variable does not include items that were not changed since previous test probe.
When you are using %SNMPFilteredTable_HTML% or %SNMPTableDiff_HTML% variables in your HTML code, you may define your own styles for the table. You may define 4 classes:.snmptable Style for the table .snmpheader Style for table header .snmprow Style for rows, rows with counters that were not changed since previous test probe .snmpchangedrow Style for changed rows, rows with counters that were changed since previous test probe
Sample:<STYLE TYPE="text/css"> <!--
.snmptable { padding: 5px; border-top: dotted thin silver; border-bottom: solid medium silver; border-left: dotted thin silver; border-right: solid medium silver }
.snmpheader { text-align: center; background: #FFFFCC; color: #000000; border-style: inset; border-width: 0 2 2 0; border-color: #333333; }
.snmprow { font-size: smaller; text-align: center; background: #E9E9E9; color: #000000; border-style: inset; border-width: 0 2 2 0; border-color: #333333; }
.snmpchangedrow { font-size: smaller; text-align: center; background: #FF0000; color: #FFFFFF; border-style: inset; border-width: 0 2 2 0; border-color: #333333; }
--></STYLE>
Also, if you are using "Alert if any item :" mode for SNMP Table test, HostMonitor checks entire table and finds not just a value that fits specified alert threshold but finds the counter that maximally satisfies specified condition.
For example:- If you setup "Alert if any item is < than 1000" condition and SNMP agent returns numbers 2222, 100, 50, 5000 then HostMonitor will report 50 as test result (1st number that fits condition is 100 but HostMonitor will continue scanning and find minimal number 50).
- If you setup "Alert if any item is > than 1000" condition and SNMP agent returns numbers 2222, 100, 50, 5000 then HostMonitor will report 5000 as test result (not 2222)
Then you may get additional information about such detected counter using the following variables:%MibOid% Represents OID (object identifier) of the variable %MibName% Using the database of compiled MIB files HostMonitor may translate %MibOID% from its numeric form to a MIB name. If you need to extend the database by including information about MIBs supported by some specific SNMP enabled device, use MIB Browser %MibNameShort% Similar to %MibName% but shows the name of the variable (plus possible index) without names of parent nodes.
E.g.- %MibOID% = .1.3.6.1.2.1.2.2.1.8.1
- %MibName% = iso.org.dod.internet.mgmt.mib-2.interfaces.ifTable.ifEntry.ifOperStatus.1
- %MibNameShort% = ifOperStatus.1
%MibType% Type of the variable %MibValue% Variable value %MibRelative% Relative value of the variable. If you setup SNMP Table test to check how counters change comparatively to the values received by previous test probes, %MibRelative% may represent: - simple difference between current and previous value (if you use "increases by", "decreases by" or "changes by" compare option)
- relative difference as a percentage of previous value (if you use "increases by (%)", "decreases by (%)" or "changes by (%)" compare option)
- average increase/decrease of the counter per second since previous test probe (if you use "increases /sec", "decreases /sec" or "changes /sec" compare option)
- Variables that represent parameters of some explicitly specified test
If you want to access the parameters of some specific test (not just the one that had triggered an action), specify the name of a test or id of the test confined by a double colon (::) in front of the name of the macro variable (%::<testname>::<macrovariable>% or %::<testid>::<macrovariable>%). E.g. if you want to access "Reply" and "Status" fields of the "Ping Yahoo" test, use the following syntax for the variables: %::Ping Yahoo::Reply%, %::Ping Yahoo::Status%
To find out ID of the test items, you may use Custom HTML report with %TestID% macro variable.
- host related variables
You can setup actions using variables that refer not to some specific test (like "CPU test for MainWebServer") but rather to test items that check the same host - HostMonitor will search for test items related to the host that triggered this action execution. E.g. if you setup CPU Usage, Memory and Dominant Process tests for Host01, Host02 .. Host99, then you may setup single alert profile with "Send e-mail" action using HTML template like:
Then if any CPU Usage test (e.g. "CPU Usage for Host05" test) will change status from Ok to Bad and trigger assigned actions, HostMonitor will find Memory and Dominant Process tests related to the same Host05 and you will get e-mail with information about CPU load, memory usage and information about process(es) that use the most of system resources (CPU, memory, Handles, etc).ver A ver B ver C E-mail triggered by
%TestName% %Status% %Reply%<br>
<br>
Related tests:<br>
<br>
%::RelatedCPU::short_table%<br>
%::RelatedMemory::short_table%<br>
%::RelatedProcess::short_table%%TestName%<br>%Status%<br>%Reply%<br>
<table border=0>
<tr><td colspan=4>CPU load:</td></tr>
%::RelatedCPU::short%
<tr><td colspan=4>Memory</td></tr>
%::RelatedMemory::short%
<tr><td colspan=4>Top Processes</td></tr>
%::RelatedProcess::short%
<table>E-mail triggered by
%TestName%<br>%Status%<br>%Reply%
<br><br>
%::RelatedTests::short_table%
Note: disabled test items ignored.
You should specify variable using two parts: prefix like RelatedProcess and suffix like short or short_table. E.g.
%::RelatedTests::short%
%::RelatedSpace::stat%
%::RelatedProcess::short_table%
%::RelatedProcess::stat_table%
Prefix tells HostMonitor what kind of tests should be selected:RelatedTests All tests related to the host. E.g. If "Cisco CPU Usage" test triggers alert, such variable provides information about ALL test items related to this Cisco device RelatedLan Ping, Trace, TCP, UDP, DNS, DHCP, NTP, SIP, RAS, Radius and DICOM tests related to the host RelatedMemory Memory tests (physical, virtual, swap memory tests) RelatedCPU CPU Usage tests RelatedProcess Process and Dominant Process tests RelatedSpace Drive Free Space tests RelatedWMI WMI tests RelatedPerf Performance Counter tests RelatedTraffic Traffic Monitor tests items related to the host RelatedSNMP SNMP Get and SNMP Table tests RelatedTemperature Various Temperature checks, like Cisco temperature, Juniper temperature, Sensatronics temperature, HDD SMART tests when temperature mode used, etc
Suffix tells what data should be displayed:short Shows test name, status, status age, reply.
E.g. result of %::RelatedMemory::stat% variable may look like
SwapTest1 Ok (3 min ago) 70%
MemTest2 Ok (30 sec ago) 50%stat Shows test name, status, status age, reply, average reply, min reply, max reply.
E.g. result of %::RelatedMemory::stat% variable may look like
SwapTest1 Ok (3 min ago) 70% (51 / 15 / 89)
MemTest2 Ok (30 sec ago) 50% (33 / 10 / 90)short_table Similar to "short" suffix (shows test name, status, status age, reply) but adds <table> and </table> tags. Such suffix can be used when variable specified for some HTML related action, e.g. "Send e-mail" action with template in HTML format or HTTP request action.
E.g. result of %::RelatedMemory::short_table% may look like
<table border=0>
<tr><td>SwapTest1</td><td>Ok</td><td>(3 min ago)</td><td>70%</td></tr>
<tr><td>MemTest2</td><td>Ok</td><td>(30 sec ago)</td><td>50%</td></tr>
</table>stat_table Similar to "stat" suffix but adds <table> and </table> tags. Such suffix can be used when variable specified for some HTML related action, e.g. "Send e-mail" action with template in HTML format or HTTP request action.
Exact result depends on where a variable is declared. HostMonitor may use Text, HTML, JSON, URL encoding rules. E.g. if you are using such variable for e-mail template, HostMonitor will use text or HTML format depending on [E-mail body: Text/HTML] switch. The same variable %::RelatedMemory::stat_table% can be resolved to text
SwapTest1 Ok (3 min ago) 70%
or it can be resolved to HTML
MemTest2 Ok (30 sec ago) 50%<table border=0>
<tr><td>SwapTest1</td><td>Ok</td><td> (3 min ago) </td><td>70%</td></tr>
<tr><td>MemTest2</td><td>Ok</td><td> (30 sec ago) </td><td>50%</td></tr>
</table>
If you are using several variables, then it may be better to use single table for all variables - use short/stat suffixes and specify <table> tags manually. E.g.<table border=0>
<tr><td colspan=4>CPU usage</td></tr>%::RelatedCPU::short%
<tr><td colspan=4>Memory</td></tr>%::RelatedMemory::short%
<table>
- Folder-related macro variables
The following variables provide information about the folder (folder that contains the test which has triggered action execution)
%Folder% The name of the folder containing the test %FolderID% Represents unique ID of the folder (integer number) %FullPath% The full folder path name %FolderComment% Folder's comment (entire comment, lines separated by CRLF) %FCommentLineNN% Returns a line #NN of a folder`s comment
Statistical variables%FolderCurrent_TotalTests% Total number of the test items in the folder %FolderCurrent_GoodTests% Number of the test items (in the folder) those have "Good" status %FolderCurrent_BadTests% Number of the test items (in the folder) those have "Bad" status %FolderCurrent_UnknownTests% Number of the test items (in the folder) those have "Unknown" status %FolderCurrent_WarningTests% Number of the test items (in the folder) those have "Warning" status %FolderCurrent_AcknowledgedBad% Number of "Bad" acknowledged test items in the folder %FolderCurrent_AcknowledgedUnknown% Number of "Unknown" acknowledged test items in the folder %FolderCurrent_AcknowledgedWarning% Number of "Warning" acknowledged test items in the folder %FolderCurrent_DisabledTests% Number of disabled test items in the folder %FolderCurrent_PausedTests% Number of paused and OutOfSchedule test items %FolderCurrent_WaitMasterTests% Number of test items with WaitForMaster status %FolderCurrent_TotalProbes% Number of test probes executed since last statistics reset %FolderCurrent_SessionProbes% Number of test probes executed since HostMonitor restart
The following variables work similar to statistical macros listed above with 1 distinction - they count test items within folder AND all descendant subfolders (not applicable to Custom HTML reports)%FolderRecursive_TotalTests% Total number of the test items in the folder and its subfolders %FolderRecursive_GoodTests% Number of the test items those have "Good" status %FolderRecursive_BadTests% Number of the test items those have "Bad" status %FolderRecursive_UnknownTests% Number of the test items those have "Unknown" status %FolderRecursive_WarningTests% Number of the test items those have "Warning" status %FolderRecursive_AcknowledgedBad% Number of "Bad" acknowledged test items %FolderRecursive_AcknowledgedUnknown% Number of "Unknown" acknowledged test items %FolderRecursive_AcknowledgedWarning% Number of "Warning" acknowledged test items %FolderRecursive_DisabledTests% Number of disabled test items %FolderRecursive_PausedTests% Number of paused and OutOfSchedule test items %FolderRecursive_WaitMasterTests% Number of test items with WaitForMaster status %FolderRecursive_TotalProbes% Number of test probes executed since last statistics reset %FolderRecursive_SessionProbes% Number of test probes executed since HostMonitor restart
Also you may retrieve summary information for specific folder using expressions like %::<fullpath>::<folder_macro>% or %::<folderID>::<folder_macro>%.
E.g. %::Root\Asia::FolderCurrent_BadTests% or %::12:: FolderCurrent_GoodTests%
You may find out FolderID using Folder Properties dialog (ID is displayed at the right bottom corner of the window).
- HostMonitor status related macro variables:
These variables represent the status of HostMonitor:
%MonitorState% - this variable may have 2 values: "Monitoring Started" or "Monitoring Stopped" %AlertsState% - this variable may have 2 values: "Alerts Enabled" or "Alerts Disabled" %HM_LastLoggingError% - represents description of last logging error (if any); can be useful for actions triggered by HostMonitor when it cannot save data into the log %HM_RccSessions% - represents number of active RCC sessions %HM_TestListFile% - name of the TestList file being used %HM_TestsPerformed% - number of tests performed since startup %HM_TotalTestItems% - total number of test items (in loaded file) %HM_GoodItems% - number of tests with "Good" status %HM_BadItems% - number of tests with "Bad" status %HM_UnknownItems% - number of tests with "Unknown" status %HM_WarningItems% - number of tests with "Warning" status %HM_AckBadItems% - number of "Bad" acknowledged test items %HM_AckUnknItems% - number of "Unknown" acknowledged test items %HM_AckWarnItems% - number of "Warning" acknowledged test items %HM_DisabledItems% - number of disabled test items %HM_PausedItems% - number of paused and OutOfSchedule test items %HM_WaitMasterItems% - number of test items with WaitForMaster status - User defined variables (UDV, also known as global macro variables)
Specifics of user defined variables vs. simple macro variables: macro variables that were described above represent different properties of the tests and you can not change their values directly. Contrary, there are user defined (global) macro variables that can be used in any of the action profiles. This type of variables may be of great use. For example if you have lots of alerts that send e-mails to different mailing lists (one action sends the mail to administrators, another to managers, 3rd action sends notifications to managers and administrators, etc). When some of the e-mail addresses have been changed you will then need to correct these addresses in all profiles that are using them. To avoid this you may define a global variables. Define several variables such as "udv_admingroup = rick@mycompany.com; brand@mycompany.com", "udv_managmentgroup = bob@mycompany.com; john@mycompany.com; kim@mycompany.com", etc and use them as a destination address for the actions: "%udv_admingroup%". Now if any of the e-mail addresses will change, you will have to track this change only in the definition of the variable. This is far more efficient then checking all action profiles that may use the address being changed.
Global variables are defined in the "User Defined Variables" dialog. This dialog is accessible from the menu "Profiles"->"Global macro variables".
To add a new variable to the end of the list go to the last existing line and press Down Arrow key. Press INSERT button to insert a new line. Press CTRL+DEL to remove variable or several selected vaiables. Press F2 when you want to change variable value or its name.
You may use popup menu items to sort items alphabetically by name or by value. Also you may use popup menu items to copy set of variables (or copy entire list) into Windows clipboard and paste variables from Windows clipboard. HostMonitor offers "Copy as CSV" and "Copy as Expression" options for copying while "paste" function detects format of such list automatically.
You can also create an HMScript that will modify variables automatically (for example in respond to some event). Moreover, you may change the value(s) of variables remotely through Telnet Service and any telnet client.
Any name of user defined variable always starts with the prefix "udv_". Even if you will forget to add this prefix to the name HostMonitor will add it automatically. When specifying the name of the variable in action parameter you have to enclose the name in `%`. When HostMonitor performs an action it will substitute the name of the variable by its` current value.
In the string that represents a value of a UDV you may use the name of another macro variable(s): e.g. date-time variables or test related variables.
- Date & time variables
To represent a date or time you may use the following variables:
%d% - Current day as a number without a leading zero (1-31) %dd% - Current day as a number with a leading zero (01-31) %ddd% - Current day as an abbreviation (Sun-Sat). HostMonitor uses system's regional settings for abbreviation format %jjj% - The day of the year as a three digit decimal number in the range of 001 to 366 %ww% - Current week as two-digit number (01-54) %www% - Current week number according to ISO 8601 specification (1st week of the year is the week with the year's first Thursday in it) %m% - Current month as a number without a leading zero (1-12) %mm% - Current month as a number with a leading zero (01-12) %mmm% - Current month as an abbreviation (Jan-Dec) using system's regional settings %yy% - Current year as a two-digit number (00-99) %yyyy% - Current year as a four-digit number (0000-9999) %uuu% - Current local time as UnixTimeStamp (seconds since 1970) %uuu[-0u]% - Current UTC time as UnixTimeStamp (seconds since 1970) %h% - Current hour without a leading zero (0-23) %hh% - Current hour with a leading zero (00-23) %h12% - Current hour using 12-hour clock (0-12,1-11) %hh12% - Current hour using 12-hour clock with a leading zero %n% - Current minute without a leading zero (0-59) %nn% - Current minute with a leading zero (00-59) %am/pm% - Returns 'am' for any hour before noon, and 'pm' for any hour after noon %AM/PM% - Returns 'AM' for any hour before noon, and 'PM' for any hour after noon %a/p% - Returns 'a' for any hour before noon, and 'p' for any hour after noon %A/P% - Returns 'A' for any hour before noon, and 'P' for any hour after noon
Please note: HostMonitor resolves test specific variables depending on the type of module where variables are used:
- if variable is used in HTML mail or HTML report, HostMonitor resolves it according to HTML encoding rules. E.g. if test name is "<local comp>", %TestName% variable will be translated into "<local comp>".
- if variable is used in ODBC Query (ODBC logging or SQL Query action) then HostMonitor resolves this variable and replaces single quotation marks (') with 2 single quotation marks (''); replaces CR LF (#13 #10) symbols with "\r" and "\n" correspondingly
- in all other cases variables are substituted as is (variables are replaced by appropriate test parameters)
This table illustrates where you can use macro variables:
| Action | Macros applicable | Action parameters where macros are applicable |
| Hangouts chat | Yes | Text |
| Microsoft Teams | Yes | Text |
| Telegram message | Yes | ChatID Text |
| Slack message | Yes | Title Text |
| Viber message | Yes | Receiver Text |
| Send message to Jabber | Yes | Jabber account Message template |
| Send message to ICQ | Yes | ICQ # (UIN) Message template |
| Show message | No | |
| Play sound | Yes | Path to the file |
| Send message to pager (TAP) | Yes | Pager ID Message template |
| Send message to pager (SNPP) | Yes | Pager ID Message template |
| Send message to beeper | Yes | Beeper # Message line |
| Send SMS (GSM) | Yes | Destination phone Message template |
| Send SMS (SMPP/IP) | Yes | Destination phone Message template |
| Send e-mail (SMTP) | Yes | Address of the sender Destination address Subject Message template Attachment |
| Record HM Log | Yes | Destination file name |
| Generate reports | No | |
| Stop/Start/Restart service | Yes | Computer name Service name |
| Remote reboot | Yes | Computer name |
| Local reboot | No | |
| Dial-up to the network | No | |
| Disconnect dial-up connection | No | |
| Execute external program | Yes | Command line |
| Start program remotely | Yes | Target host Command line Working directory |
| Kill process | Yes | Target host Process ID Process name |
| Log Event | Yes | Computer name Event source Event description |
| SQL Query | Yes | ODBC data source SQL Query |
| HTTP request | Yes | Host name HTTP request |
| Send data to TCP/UDP port | Yes | Init packet Final packet |
| Syslog | Yes | Message |
| SNMP Set | Yes | Agent address Value |
| SNMP Trap | Yes | Destination address Agent address Enterprise MIB OID MIB Value |
| Repeat test | No | |
| Change test interval | No | |
| Execute HMS script | Yes | In the HMS script file |
E.g. message template for pager notification can look like: "Hi admin, now %datetime% host %TestName% changes status to %status%. Your monitor."