|
 |
|
|
| | What's New |
| | |
|
|
 Test related improvements Test related improvements
- URL test improvements
- SSH test improvements
- Domain Expiration test improvements
Unfortunately WhoIs protocol specifications do not describe data format so each registrar uses its own format and may change it from time to time.
We have to change HostMonitor code accordingly.
- Host Free Space test (VM systems)
HostMonitor set "Unknown" test status with "invalid datastore counters" reply if some datastore on target host machine is offline/unmounted.
New HostMonitor considers such offline datastore as disk with no free space
- "Master does not expire" option added into Test Properties dialog
This option can be set for some master tests, it overrides global option "Consider status of the master test obsolete after N seconds"
located in Options dialog. The option can be useful when master test execution requires significant system resources (e.g. count files
on hard drive) and you know conditions checked by such test cannot be changes frequently
RMA for UNIX v1.30: the following test methods were improved
- File Integrity
- Text Log
- Shell Script
The following Shell Scripts where modified in order to support macOS (plus some changes for NetBSD, OpenBSD and Solaris)
- SYSTEM: number of processes (runnable)
- SYSTEM: number of processes (total)
- SYSTEM: number of processes (zombie)
- SYSTEM: Mem Free
- SYSTEM: Swap Free
- Process: number of instances
- Process: %CPU usage (average)
- Process: %CPU usage (raw)
- Process: Memory usage
- Process: Virtual Memory usage
- USER: number of processes
You may download new scripts and import them using HostMonitor menu Profiles -> Script Manager -> Import.
 GUI improvements GUI improvements
- The following windows can be resized
- RMA Server Status window
- RCI Status window
- RMA List
- Auditing Tool improvements: now it checks size of log files, memory manager efficiency and some other parameters
 Other Other
- "Import from text file" function improved
- Undocumented option for HTTP Request action allows you to change maximum allowed length of HTTP header
("undocumented" means this option is not accessible thru GUI; you may add line like HttpActMaxHeaderLen=1024
into [Misc] section of hostmon.ini file and restart HostMonitor)
 The following issue was resolved The following issue was resolved
- HostMonitor version 10.30-10.64 could skip (do not execute in time) some dependent tests if %FolderCurrent..%
or %FolderRecursive..% variables used in master expression. Fixed
|
|
|
 Improvements Improvements
HostMonitor, RCC, Passive and Active RMA agents for Windows - Folder/File Availability test method supports FTP, FTPS and SFTP protocols.
Now Folder/File Availability test can check:
- files on local file system;
- files on shared network disk connected to HostMonitor system (using network client installed on local Windows system);
- files on system where Remote Monitoring Agent is running;
- files on shared network disk connected to the system where Remote Monitoring Agent is running;
- files on FTP and FTPS server (FTPS uses SSL);
- files on SFTP server (SFTP uses SSH protocol).
When you specify file name you may use the following formats:
| If you check file on | path should be specified like |
- local file system
- or system where RMA for Windows is running; |
<disk>:\<path>\<file>
Examples:
C:\folder\subfolder\error1.log
C:\folder\log-%mmddyyyy%.txt
D:\%newestfolder%
D:\logs\%ddmmyy[-1d]%\%oldestfile%
|
| - system where RMA for UNIX is running; |
/<path>/<file>
Examples:
/var/logs/sql/
/var/logs/%newestfolder%
|
| - shared network disk connected to HostMonitor or Windows RMA agent |
\\<hostname>\<path>\<file>
Note: we recommend to use UNC path to the resource even if you set mapped disk drive. HostMonitor started as Windows service will not see
mapped disks but will be able to check resource specified by UNC path
|
| - SFTP server |
sftp://<username>@<server>[:<port>]/<path>/<file>
Examples:
sftp://user1@ssh.microsoft.com:22/uploads/log.txt
sftp://user1@ssh.microsoft.com:22/uploads/%oldestfile%
sftp://user1@ssh.microsoft.com/uploads/%mmddyy[-1d]%
|
| - FTP / FTPS server |
ftp://<username>@<server>[:<port>]/<path>/<file> [<dateformat>]
ftps://<username>@<server>[:<port>]/<path>/<file> [<dateformat>]
Examples:
ftp://user1@microsoft.ftp.com:21/uploads/log.txt
ftp://user1:pswd1@microsoft.ftp.com:21/uploads/
ftps://user1@microsoft.ftp.com:990/%newestfolder% [DMY]
ftps://user1@microsoft.ftp.com/uploads/%ddmmyy%
Notes:
<dateformat> parameter is optional; if specified, it should be inside square brakets. Useful when you need to check file modification time
(necessary for some servers due to limitations of FTP protocol
Available date formats:
[MDY] - month, day, year, like 01/25/91 or 01-25-2005
[DMY] - day, month, year, like 25/11/91 or 25-11-2005
[YMD] - year, month, day, like 91/11/25 or 2005-11-25
[YDM] - year, day, month, like 91/25/01 or 2005-25-01
|
 The following issue was resolved The following issue was resolved
- Log Analyzer: in some cases interactive HTML report did not show charts. Fixed
|
|
|
 New feature: external syslog New feature: external syslog
- HostMonitor may send test results, action results, diagnostic messages, RCI and Active RMA related messages to external Syslog server.
Using Options dialog ("External Syslog" page) you may tell what exactly data should be sent to syslog server:
Test results
| Brief mode | send data to the server when test status changes |
| Reply mode | send data to the server when test status or reply value changes |
Action results
| Send errors | send data to the server when action failed for some reason |
| Send all results | send information about failed and executed actions |
Monitor messages
| Send errors | send to the server error diagnostic messages (e.g. HostMonitor cannot open RCI port for listening or cannot create report) |
| Send all results | send to the server all diagnostic messages |
Active RMA log
| Rejected requests | with this option selected HostMonitor will send information about rejected connection requests from Active RMA |
| All connections | HostMonitor will send information about rejected and successful connections from the agents |
RCI log
| Rejected requests | with this option selected HostMonitor will send information about rejected connection requests from the remote users. E.g. RCC, Web or Telnet operator tried to connect from non-allowed IP address or used invalid password |
| All connections | HostMonitor will send information about rejected and successful connections from the remote users (RCC, Web Service and Telnet). Options located on RCI page tell HostMonitor to exclude or include WatchDog account (account used for WatchDog application). |
Facility
The logging facility parameters allow administrators to logically separate messages. Messages with different facilities may be handled differently, e.g. write records to separate files, forward them to different destinations, etc.
That's why HostMonitor allows specifying facility number for each kind of logging data.
Severity
Severity level of the message set automatically by HostMonitor:
| Critical | - reserved for cluster mode, not used yet (e.g. cluster node disconnected) |
| Error | - tests status changed to "Bad", "No answer" or "Bad contents";
- action failed;
- error diagnostic message (e.g. HostMonitor cannot create report or ODBC logging pool is full) |
| Warning | - test status changed to unknown or warning;
- rejected RMA and RCI connections (e.g. IP address not allowed or invalid password used) |
| Notice | - other test statuses (e.g. test status changed to "Ok" or test was disabled);
- operator acknowledged "bad" test status;
- acknowledged test fails again with different reply |
| Informational | - executed actions;
- accepted RMA and RCI connections;
- informational system messages (e.g. monitoring started) |
 Improvements Improvements
- Test Info dialog: new popup menu items allow you copy test and action results (quick log pane), copy HDD SMART table into clipboard
- Test Info dialog: button beside test name field may switch display mode from "name" to "full path+name"
 The following issue was resolved The following issue was resolved
- HostMonitor 10.56 could inactivate Views. Fixed
|
|
|
 HostMonitor/RCC improvements HostMonitor/RCC improvements
- Increased folder records capacity
- Minor speed improvements
- When you select target folder (e.g. for Copy/Link/Move operation) you may use Find and SearchAgain options (click the button or use hot keys Ctrl+F to start search, F3 to continue search)
- When you select target folder (e.g. for Copy/Link/Move operation) you may use "Toggle between recent folders" option
- When you choose master test you may use "Toggle between recent master tests" option
 RMA Manager improvement RMA Manager improvement
- Command line parameters -import:<filename> and -import-quit:<filename>
tells RMA Manager to import list of agents from CSV file ("-import-quit" command tells RMA Manager to quit when operation complete)
 The following issue was resolved The following issue was resolved
- WebService did not show memory tests in TopHosts pane (versions 10.50-10.54 were affected). Fixed
|
|
|
 Improvements Improvements
- HostMonitor and RCC: new popup menu item "Move" offered in "Views" mode, allows to move selected test items to specified folder
- HostMonitor and RCC: when you choose master test you may use Find/SearchAgain buttons (or Ctrl+F to start search, F3 to continue search)
- HostMonitor: "Send SMS (GSM)" action allows you to specify custom list of commands for your modem.
When you choose "modem type: custom" (using Options dialog) HostMonitor creates simplified script for your modem considering PDU/Text mode,
PIN number, service center number. E.g. commands may look like
AT+CMGF=0
AT+CMGS=%PDULen1%>%MessagePDU%^Z
another example
AT+CPIN="1111"
AT+CSCA="+12065415500"
AT+CMGF=1
AT+CMGS="%DestPhone%">%MessageText%^Z
Also, this mode tells HostMonitor to ignore most of errors, often SMS can be delivered even if some commands were rejected by modem.
You may modify commands manually, using different commands for primary and backup modem. Use the following variables and special symbols:
| ^Z | as EOF symbol |
| ^J | as LF (line feed) symbol |
| > | tells HostMonitor to wait for > prompt from modem |
| %DestPhone% | destination phone number specified for the action |
| %MessageText% | text message created by "Send SMS (GSM)" action according to specified template and test results |
| %MessagePDU% | the same message encoded as Packet Data Unit (contains destination number) |
| %PDULen% | size of the PDU message |
| %PDULen1% | size of the PDU message (%PDULen1%==%PDULen%+1) - for some modems you need %PDULen%, for other %PDULen1% |
- HostMonitor: now you may use %TestID% variable for private log path
- HostMonitor: undocumented option for SLA reports allows you to change format used for image files
("undocumented" means this option is not accessible thru GUI). If you add TestIDAsImageName=1 line into
[Reports] section of hostmon.ini file and restart HostMonitor then SLA reports will use the following format for image files:
img<historyModeID>-<TestID>.gif
- HostMonitor: several new checks for Auditing Tool
- Telnet service: shows ID of each folder (fl command)
 The following issues were resolved The following issues were resolved
- HostMonitor 10.50 set %BadTests%, %UnknownTests% counters to 0 when these variables used in "Header" section of Custom HTML report. Fixed
- RMA agent could not check service status if service name ends with space characters. Fixed
|
|
|
 Optimization Optimization
-
Many modules were redesigned in order to reduce CPU usage and increase responsiveness of HostMonitor and RCC GUI, Web and Telnet interfaces. If you have over 30,000 test items AND 10,000 folders, you will see the difference.
The following modules, that were too slow on heavy configurations with many thousands of folders, now work much faster:
- Auditing Tool
- Built-in Replicator
- Import from text file
- SuperMatrix window
- HTML, DBF, WML, Compact HTML, SLA and DashBoard reports
- Custom HTML reports improved as well, however such reports still may require a lot of time (e.g. 10-20 sec for 30,000 test items report - depending on your system and report template)
- Web interface (especially DashBoard pane)
Basic "everyday" functions were improved as well:
- You can remove and copy folder with thousand subfolders much faster
- HostMonitor removes, copies and modifies large amount of tests much faster
- Now you can easily reset, enable, disable, pause or resume set of 10,000 test items
- Also HostMonitor needs less time when you create set of tests for range of IP addresses (e.g. Ping tests for 10.10.5.1-10.10.25.254)
- Some auxiliary windows open much faster (like "Select master test" window)
- and so on
Note: GUI works more slowly on Windows 10; we changed some code for this OS and HostMonitor 10.50 works better however new Windows API
does not work as nice as Windows 7 or Windows Server 2008
More speed, less CPU usage
- Faster initial startup, profiles and test list load: yes, you don't restart HostMonitor every day but you
may start Remote Control Console or open web interface 10 times a day - now RCC, telnet and Web services load and process data faster.
- Also new HostMonitor and Web Service modules consume less CPU resources. This is important when many remote
operators use Web interface at the same time.
Scripts on client side (web browser) use less CPU resources as well.
- Show tests in subfolders
We recommended to disable this option when you have many thousands of tests and folders. Now it's not a big issue. GUI works faster,
also it does not show all 50,000 of your test items right away. It will show up to 2,000 items (plus all items from last visible
folder); if you need to see more items, you may click on last item labeled "Some items from subfolder were not displayed" and use
popup menu item "Show other test items from NNN subfolders". However it's better to switch folder/subfolder when you need to see
test items below.
 Test related improvements Test related improvements
- HostMonitor and RMA for Windows: URL test supports "Accept-Encoding: gzip" HTTP header option
(can be specified as optional headers parameter). If necessary HostMonitor, will unzip data received from the server
- HostMonitor and RMA for Windows: better diagnostic messages for Process test method
- HostMonitor: for optional status processing and actions triggered by SNMP Trap test items you
may use macros like %OidVal.1.2.3.5.204.0%. Such macro returns value of the specified variable (OID 1.2.3.5.204.0) received within SNMP Trap message
- HostMonitor: 3 new variables for actions triggered by File Availability test method: %FileAge_Min% (minutes), %FileAge_Hour% and %FileAge_Day%
- HostMonitor: %TestProbeTime% variable returns test execution time in milliseconds
 The following issues were resolved The following issues were resolved
- HostMonitor: if you are using folder-level variables in "This test depends on expression" test property
(officially such option was never supported) then HostMonitor version 10.10 - 10.30 did not execute some of such tests.
Problem fixed however such option is still "undocumented" and behavior can be changed in future versions.
- RCC did not remove Test Links. Fixed
|
|
|
 New features (HostMonitor and RMA for Windows): New features (HostMonitor and RMA for Windows):
- New test method HDD SMART
Checks hard disk health, temperature and other parameters using S.M.A.R.T. data; it can be effectively used to prevent HDD data loss
- New test method Interfaces status
This test allows you to check all or some specific interfaces on SNMP enabled device (server, router, etc). HostMonitor may warn you when network interface goes down or changes its administrative and/or operative status
- New macro variables related to HDD SMART test methods:
%Disk_Name%
%Disk_Temp%
%Disk_Hours%
%Disk_Relocated%
%Disk_Pending%
%Disk_Uncorrectable%
%Disk_SpinupTime%
%Disk_SpinupRetries%
%Disk_ErrorRate%
%Disk_Timeouts%
%Disk_AlertReason%
%Disk_AlertValue%
- New macro variables related to Interfaces Status test methods:
%InterfacesDOWN_Index%
%InterfacesDOWN_Name%
%InterfacesChanged_Index%
%InterfacesChanged_Name%
 HostMonitor and RMA test improvement HostMonitor and RMA test improvement
- SSH test supports RSA keys (ssh-rsa). New code considered as experimental and disabled by default.
You may enable it individually for HostMonitor or some RMA agents - add SSHMode=1 line into
[Misc] section of hostmon.ini file and restart HostMonitor (modify rma.ini file instead of hostmon.ini if you want to
enable this option for Remote Monitoring Agent)
- When test performed by HostMonitor then %AgentAddr% variable returns "localhost" string. You may tell HostMonitor
to use real IP address of the system (system where HostMonitor is running) instead: add HMIPforAgentAddr=1 line into
[Misc] section of hostmon.ini file and restart HostMonitor
 HostMonitor and RCC GUI improvements HostMonitor and RCC GUI improvements
- If you setup HDD SMART test items then 3 new modules designed for Top Hosts pane may show oldest, hottest and worst HDD disks among all monitored systems:
oldest - disks with highest power-on days counter;
hottest - disks with highest current temperature;
most bad sectors - disks with highest number of relocated, pending and uncorrectable sectors
- Improved "Choose network interface" dialog window (used by Traffic Monitor and Interfaces status test methods) and "Network interfaces" page displayed by System Info tool:
- in addition to current operative status HostMonitor retrieves and shows admin (desired) status for each interface;
- also when device has a lot of interfaces, new HostMonitor, RCC and RMA retrieve necessary data from SNMP agent faster than previous versions
- Minor improvements related to RCC GUI
 Web Service improvements Web Service improvements
- If you setup HDD SMART test items then 3 new modules designed for Top Hosts pane may show oldest, hottest and worst HDD disks among all monitored systems:
oldest - disks with highest power-on days counter;
hottest - disks with highest current temperature;
most bad sectors - disks with highest number of relocated, pending and uncorrectable sectors
- Top Hosts pane allows you to move (drag&drop) groups, e.g. you can move "Network: slowest web site" group to the right column
- Some corrections related to "multi-byte" languages such as Japaneese, Chineese, Korean
 The following issue was resolved The following issue was resolved
- When you create new test items (using Network Map Add or Clone operation) then HostMonitor could create new folders with
invalid variable name (var_targetIP instead of fvar_targetip). Fixed
|
|
|
 HostMonitor tests improvements HostMonitor tests improvements
- HostMonitor and RMA for Windows support SNMP v3 privacy - DES, 3DES and AES encryption. 4 test methods affected:
- SNMP Get
- SNMP Table
- Traffic Monitor
- Memory tests
- SNMP Get test method: fixed mistake related to "Check OPAQUE data for float numbers" option
 HostMonitor reports improvements HostMonitor reports improvements
- Now you may adjust colors for charts generated for SLA reports. You may create one or several color
profiles, assign name starting with "SLA " or "SLA-" (case insensitive, e.g. "Sla Blue palette", "SLA-White") and use these color palettes for SLA reports
- New HostMonitor creates SLA reports with charts 2-4 times faster (depends on system CPU)
- If you setup HostMonitor to generate many reports (especially SLA reports with charts) using timer (e.g. generate 200 reports for 100 folders every 5 min), HostMonitor responsiveness could be very poor. New version works better
- HTML reports optimization ("simple" HTML reports)
- report files require less disk space
- HostMonitor generates reports about 10% faster
- Web browsers load new reports 20-30% faster (depends on you web browser)
- HTML log files optimization
- 30% smaller file size
- Web browsers load new log files about 20% faster
Note: even if log file was created by old HostMonitor and there are some old records, you will see improvements. If you are not using
"automatically change the log every day/week/month" options and log file is large, we recommend to backup and zip or move old log file
- HostMonitor will create new log file automatically
 Log Analyzer reports improvements: Log Analyzer reports improvements:
- HTML reports optimization
- report files require less disk space
- Web browsers load new reports 20-30% faster (depends on you web browser)
- New variable can be used in report template: %TestID% - represents unique ID of the test
- If you are not using templates and you need to use links pointing to some specific test items, you may add
Reports_AddTag=1 line into [Misc] section of logsman.ini file. Then
Log Analyzer will add tags like <a name="55"> to each item within reports (using real test ID instead of 55)
- New option for reports "Create charts, interactive mode" allows you to create reports like these
sample1, sample2
(click on test item to open/close chart)
There are several advantages over "static" reports with charts:
- much smaller report size (3-10 times smaller, depending on data and chart size)
- much faster generation time
- entire report created as single HTML file, its easy to attach report to e-mail (no hundreds GIF files necessary)
- interactivity - you may open and close charts for specific test items at any time
There are some drawbacks as well:
- run-time interactive chart generation is slow, if you want to check charts for many test items, this will take some time (speed depends on
your web browser, e.g. Chrome and Opera works pretty well, while Edge and especially IE is much slower)
- in order to work with interactive charts you need access to internet.
If your system does not have internet access, you may download the following file
https://www.ks-soft.net/download/libs/json/set1.zip, unzip 3 files
(jquery.min.js, raphael.min.js, morris.min.js) and make them available using your corporate web server; then you need to modify logsman.ini file - add line like
ExternalScripts=<script src="http://path_to_the_file_on_your_server/jquery.min.js"></script><script
src="http://path_to_the_file_on_your_server/raphael.min.js"></script><script src="http://path_to_the_file_on_your_server/morris.min.js"></script>
into [Reports] section and restart Log Analyzer
 Web Service: Web Service:
- Interface could not work with some combinations of proxy and web browsers. Fixed
|
|
|
 HostMonitor and RMA improvements HostMonitor and RMA improvements
- SSH test improvements:
- diffie-hellman-group14-sha1 key exchange
- aes128-ctr, aes192-ctr, aes256-ctr ciphers
- URL test: you can enable or disable some SSL/TLS protocols using "undocumented" option. "Undocumented" means
the option is not accessible thru GUI, you need to modify hostmon.ini file - add line like
sslProtocols=26882
into [Misc] section of hostmon.ini file and restart HostMonitor (in order to apply changes).
sslProtocols=2720 enables SSL 3 + TLS 1.0, 1.1, 1.2 (disables SSL2)
sslProtocols=2688 enables TLS 1.0, 1.1, 1.2 (disables SSL)
sslProtocols=2560 enables TLS 1.1 and TLS 1.2
sslProtocols=2048 enables TLS 1.2 only
Note: in order to use TLS 1.1 and 1.2 protocols you need to run HostMonitor on Windows 7, Windows Server 2008 or newer Windows
- HTTP Request action allows HTTPS requests - if you need HTTPS request, specify target host using
https:// prefix (e.g. https://www.google.com). For HTTP requests you may use http:// prefix or specify host name without any prefix (e.g. www.google.com).
Note: HostMonitor will perform request even for hosts with invalid certificates (expired or certificate with wrong hostname).
You may send GET or POST requests (POST data should be provided in Request field, separated from header with 1 empty line). If you do
not specify content-type for POST request, HostMonitor will use default type (Content-Type: application/x-www-form-urlencoded).
For example you may send messages to SLACK or Telegram messenger using HTTP Request like the following
-- SLACK action parameters --
Host: https://hooks.slack.com
Port: 443
Request:
POST https://hooks.slack.com/services/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 HTTP/1.1
Host: hooks.slack.com
Content-Type: application/json
{"channel": "#hmonitor", "username": "tom", "text": "TestName:%TestName%
Status: %Status%
Reply: %Reply%
Recurrences: %Recurrences%", "icon_emoji": ":ghost:"}
-- Telegram action parameters --
Host: https://api.telegram.org
Port: 443
Request:
POST https://api.telegram.org/bot179425811:AAHhTlq1OWvjRwVY_ik5VlJPz53DYoldjhg/sendMessage
Host: api.telegram.org
Content-Type: application/json
{"chat_id": "@hmtestchannel",
"text": "TestName:%TestName%
Status: %Status%
Reply: %Reply%"}
- SQL Query action supports variables in datasource field. E.g. you may use folder-related variable
%fvar_datasource%, this way single action profile assigned to different test items may send requests to different databases
- HMScript: optional parameter "forcelog" for RefreshTestID and RefreshIrregularTestByID commands -
tells HostMonitor to record test result into log file(s) regardless of logging mode and test result (effects just 1 test probe
caused by "Refresh" command). In other words test result will be recorded even if you are using Brief logging mode and test status
did not change.
Example:
RefreshTestByID 10000 forcelog
RefreshIrregularTestByID 10000 forcelog
- Folder Properties dialog: new popup menu item "Remove all" allows you to remove ALL variables specified
for the folder at once
|
|
|
 HostMonitor, RMA and RCC improvements HostMonitor, RMA and RCC improvements
- New test method: OPC test performs OPC requests over HTTP and HTTPS protocols and verifies retrieved data
- New popup menu item "Real time chart" available for SNMP Get test items (when MIB Browser installed),
utility displays real-time charts for one or several counters (up to 4 counters)
- If a lot (e.g. 20,000) of test items set with "This test depends on expression" option, HostMonitor could work slowly.
Version 10.10 works faster and uses less CPU resources
- If you set account information for VMWare related tests performed by
Remote Monitoring Agent using test property "Connect as" (you are not using Connection Manager), then HostMonitor did not sent password
to the agent. Fixed
- Log Visualizer: fixed GUI issues on Windows 10
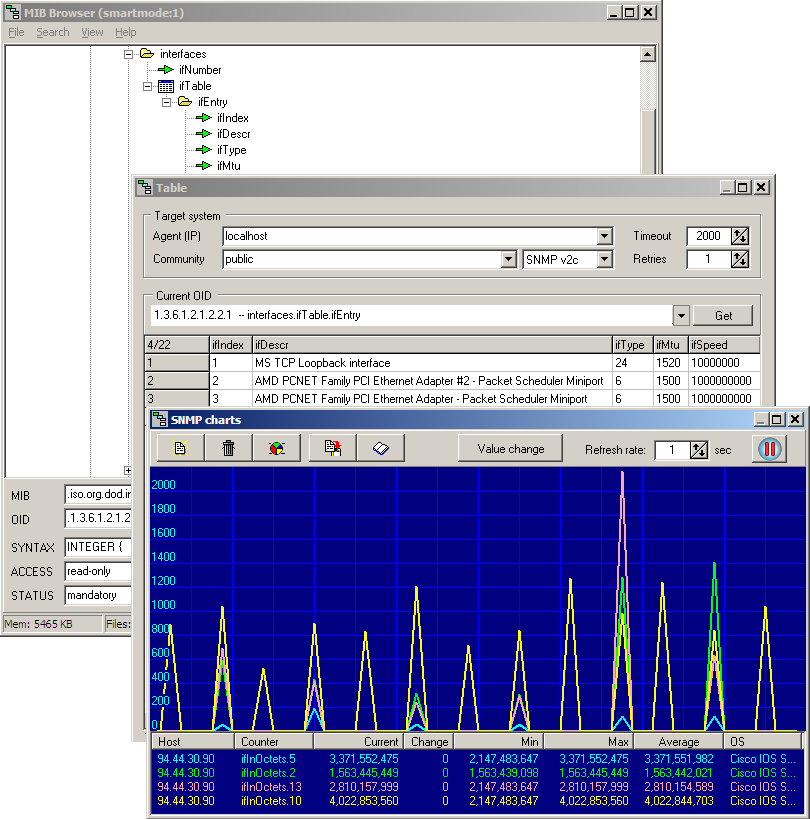
 MIB Browser improvements MIB Browser improvements

MIB Browser offers new tools:
- SysInfo
- Table
- Charts
SysInfo
This utility connects to target SNMP agent and retrieves up to date system information such us OS description, uptime, disk free space, memory usage, network interfaces.
Tables
Connects to target SNMP agent and retrieves current values of all counters that belong to specified table. E.g. if you select ifTable element,
MIB Browser will display detailed information about all network interfaces installed on target device, including interface description,
physical address, speed, admin and operational status, total number of octets received on the interface, errors and so on.
Popup menu allows you to copy all fields within selected column or row into clipboard, copy entire table into clipboard, copy OID related
to selected cell. For a numeric counters you may use "Chart" menu item - display counter value as real-time charts.
CHARTS
This utility displays real-time charts for one or several counters (up to 4 counters). You can choose counters using main window,
SNMP Get window or Table window. MIB Browser may monitor counters provided by one or several SNMP agents, e.g. you may see traffic
on your server and your router at the same time.
You may set refresh rate, pause and resume monitoring, choose color palette, set one of the following visualization modes:
- Counter value
- Value change
- Value change /sec
- Percentage change
Then you may store settings and counters using profiles.
MibBrowser does not use Windows API for SNMP requests anymore, this helps to avoid some Windows problems and allows you to choose
protocol version on any Windows platform (note: HostMonitor does not use Windows API for SNMP related tests since version 6)
|
|
|
 MIB Browser improvements MIB Browser improvements
- Redesigned MIB file compiler works much much faster
- Now compiler's "smartmode1" is enabled by default, this helps to avoid compiling problems experienced with some MIB files
- Also fixed problems related to SNMP Traps v1 specified in some MIB files
- Progress indicator
- Other GUI improvements
- New standard database includes over 15,000 nodes from over 100 MIB files
- Important note: new MIB Browser can load old database create by old MIB Browser however we
recommend install standard pre-compiled database and re-compile your custom MIB files (if you have any) using new version of the software.
If you update old Advanced Host Monitor package then installation program will keep your existing database. You may retrieve new
MIB database from this archive - just unzip and replace MIBDATA.LST
and MIBTREE.LST files located in HostMonitor data folder (usually this is C:\ProgramData\HostMonitor\
folder on Windows Vista and newer systems or C:\Program Files\HostMonitor\ on old Windows XP/2003 systems)
 HostMonitor and RMA improvements HostMonitor and RMA improvements
- New software uses OpenSSL version 1.0.2e
- Now AES module used by SSH test and Certificate Expiration test methods supports AES256-cbc and AES192-cbc ciphers (in addition to AES128-cbc)
 HostMonitor and RCC improvements HostMonitor and RCC improvements
- System Info utility could not retrieve disk usage information from some BSD systems. Now improved and works with various BSD systems
- Test Properties-Comment dialog automatically adjusts witdth of titles column when alternative titles specified by AlternativeCommentTitles option
- SNMP related test methods can work with new MIB database
|
|
|
 Improvements Improvements
- HostMonitor and RMA for Windows: Ping test offers new option "Alert if Jitter over N ms".
Jitter - amount of variation in response time, calculated by using the following formula Jitter = SquareRoot( SumOf((ReplyTime[i] - AverageReply)^2) / (ReceivedPacketCount-1) )
(when this option enabled, HostMonitor will send at least 3 ICMP packets)
Now HostMonitor may set 6 statuses for Ping tests:
| "Ok" | this status used when Jitter" option is enabled and Jitter time within specified limit
(when "Alert if lost ratio" option enabled, it should be within specified limit as well) |
| "Host is alive" | this status used when "Jitter" option was not enabled and loss ratio within specified limit |
| "Bad" | this status means either Jitter or Loss ratio is out of the limits |
| "No answer" | HostMonitor sets "no answer" status when does not receive any response from target system |
| "Unknown host" | host name could not be resolved to IP address |
| "Unknown" | test performed by Remote Monitoring Agent and there is some RMA related error (e.g. HostMonitor cannot connect to the agent) |
Also there is new "Display: Jitter" option for Ping test
- %AlertThreshold% variable for Ping test may return values like
50% lost; Timeout: 1000 ms - this format used when "jitter" option is not enabled
50% lost; Jitter: 100 ms - when both "lost" and "jitter" alert options used
Jitter: 100 ms - when only "jitter" alert option enabled
- %AlertThresholdValue% variable for Ping test returns timeout value (as before) or jitter threshould (if "Jitter" option enabled for the test)
- New Ping test related variables can be used as action parameters, Custom HTML report variables, custom field, etc:
%Jitter% - amount of variation in response time, in milliseconds
%LostRatio% - ratio of lost packets to total transmitted packets
Note: when you setup Ping test with "Alert if Jitter.." option disabled and "Lost ratio" option set to 100% and you are not using Lost, Received or Jitter display option
then HostMonitor (or RMA) will wait for SINGLE received ICMP packet and %Jitter% variable will be set to -1 (unused)
- HostMonitor and RCC: Test Info window may show Loss ratio and Jitter in "reply" field (Ping test)
- HostMonitor and RMA: Process test: sometimes damaged Windows Performance Counters can lead to memory leakage.
New HostMonitor should be able to detect this problem and display "Windows Perf Counters corrupted?" message. If some test item returns such error,
you should rebuild Windows Performance Counters
- HostMonitor and RMA: Certificate Expiration test: HostMonitor version 10.00 (and RMA 5.00) uses new version of OpenSSL
library where TLS 1.0 protocol is disabled by default. HostMonitor 10.06 will try use TLS 1.0 if your web server does not support TLS 1.2
- RCC: System Info window may request data without suspending other requests (e.g. you may check or modify
test settings, disable or pause test items while RCC requesting system information from HostMonitor or Remote Monitoring Agent)
- HostMonitor and RCC: "Show popop window" action displays redesigned windows

- HostMonitor and RCC: when you modify RMA agents list or select agent for the test you may sort agents by name, version, target OS and other parameters
- HostMonitor and RCC: other GUI improvements related to System Info window, "Choose Remote Monitoring Agent" window, etc
- HostMonitor: User operations log works a little faster when you remove a lot of test items at once
 The following issues were resolved The following issues were resolved
- RMA for Windows: if you setup Service or Process test using RMA agent and check list of services/processes running on
remote system, Test Properties window displayed processes running on local system (system where RMA is running), instead of processes running on
specific target system (while test itself works correctly). Affected RMA version 5.00 only. Fixed
- HostMonitor and RCC GUI: Test Properties dialog: when you setup one of the following tests: DNS, URL, SOAP or File Integrity
using Passive RMA (Remote Monitoring Agent) then "Test"/"Get CRC" function could provide wrong value. Affected HostMonitor version 10.00 only.
Fixed
- HostMonitor: User operations log could write duplicated records on "Test link" operations. Fixed
- HostMonitor and RMA: Certificate Expiration test could show "SSL cannot be initialized" error message instead of
correct "SSL handshake failed" message. Fixed
|
|
|
Advanced Host Monitor version 10 works faster and offers new tools such as Network discovery, built-in Replicator and System information.
Optimization: HostMonitor 10 works faster
- HostMonitor writes to disk test list and stats (.HML file) much faster
- Also it works faster with profiles (actions, reports list, shell scripts, etc). May be you will not notice any difference here because these files usually small
- HostMonitor and RCC GUI works faster when it
needs to display a lot of test items (e.g. you switch from one folder with 2000 test items to another with 3000 items).
About 20-50% faster, depending on folder structure and options. Especially
if you setup HostMonitor/RCC to display custom fields - in such case new GUI can switch folders twice faster than HostMonitor 9
- HostMonitor creates Text and HTML reports about 10-30% faster (depending on report and settings).
- HostMonitor creates Custom HTML reports about 50% faster than old version
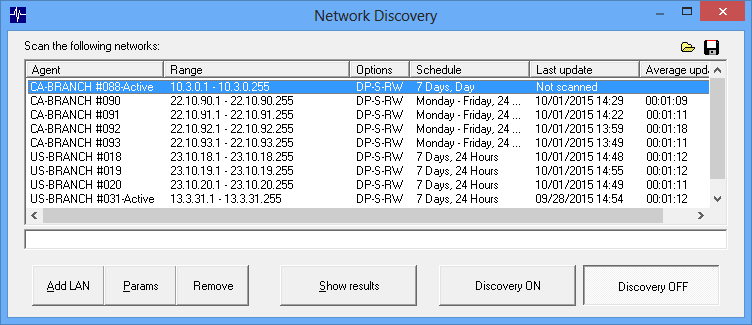
Network discovery
Menu LANs provides access to new function - now you may setup network records for scanning and HostMonitor or RMA will find all systems
in the LANs (well, at least systems that can be discovered by ICMP, TCP, SNMP, DNS, MAC requests).

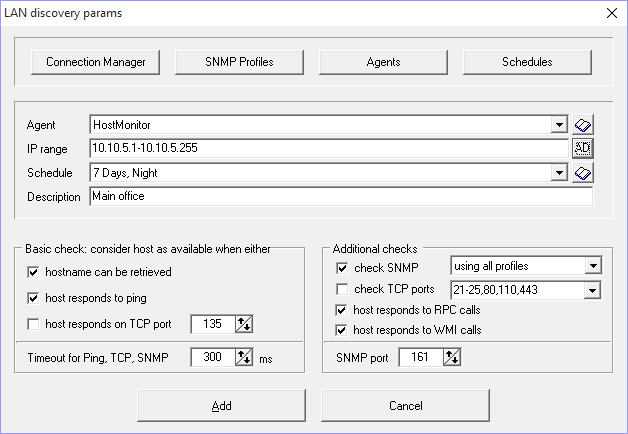
Networks can be scanned by HostMonitor itself, Active RMA or Passive RMA for Windows. You may set agent, IP range, schedule, short description and scanning options:
- consider host as available when either:
- hostname can be retrieved;
- host responds to ping;
- host responds on specific TCP port
- timeout for Ping, TCP connects and SNMP requests
- SNMP port
- check if there is SNMP agent using one or list of SNMP credentials
- check additional TCP ports
- check if host responds to RPC calls
- check if host responds to WMI calls
IP range can be set like 192.168.1.0/24 or 192.168.1.1-192.168.1.255. Also HostMonitor may show LAN information retrieved from domain controller.

If you decide to use SNMP check (very useful option that allows to detect type of various network devices), please make sure
you setup SNMP credentials used in your network (click SNMP Profile button and setup credentials).
If network discovery started, HostMonitor and Remote Monitoring Agents will scan selected networks in background and update
database when any changes detected. At any time you may open "Network map" window and see up to date map of your network.
Note: HostMonitor and RMA agents do not use a lot of system resources for such scan (even for large networks) so changes
in network can be detected with some delay (e.g. new system in network will be detected 5 min after system turned on
- exact time depends on number of LANs, number of hosts in the LAN and other parameters).
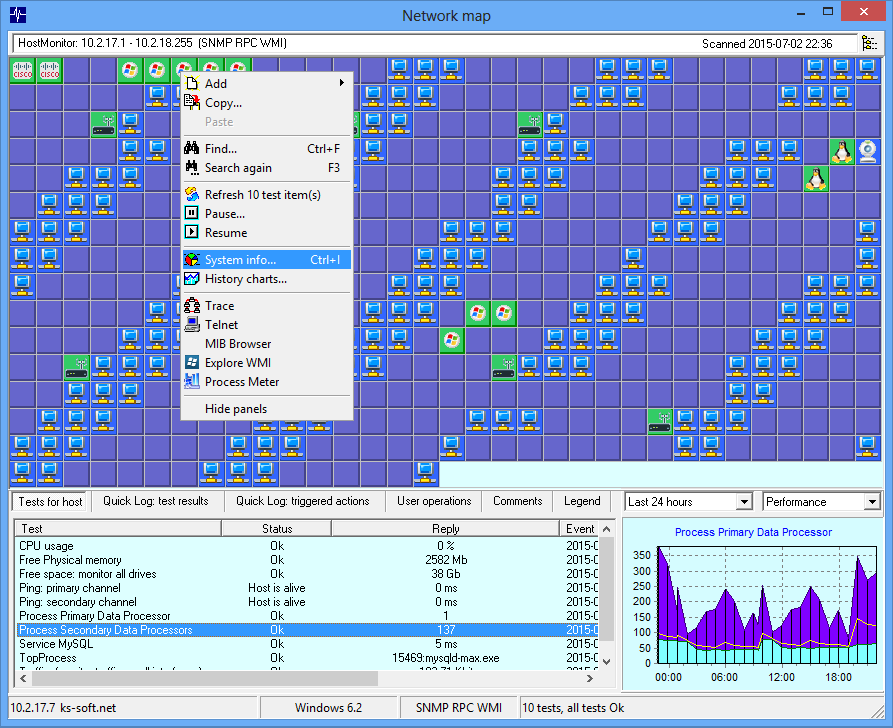
Network map
Network map window shows all hosts within selected LAN, HostMonitor paints cells in different colors depending on host properties
and displays icons when possible (when size of the window is big enough for selected network), so you can easily identify Windows
and Unix systems, CISCO routers, Apple devices, Printers, etc.

If there are some test items related to selected host, HostMonitor will group all test items related to this device and display
tests in "Tests for host" list. HostMonitor will paint hosts in yellow or red when any test related to the host has "unknown" or
"bad" status accordingly.
Lower pane displays consolidated information related to selected host. There are several pages in this pane
- Tests for host - all test items related to the host
- Quick Log: test results - latest test results for all test items related to the host
- Quick Log: actions - latest actions triggered by all test items related to the host
- User operations - list of latest operations such as paused, disabled tests...
- Comments - user comments
- Chart for selected test item
Performance chart shows graph using information about minimum, maximum and average reply values of the test item over selected
time interval. Availability chart - shows graph using information about alive/dead/unknown test results ratio over selected time
interval
You may choose any of the following time periods to display:
- Today
- Yesterday
- Last 24 hours
- Last 48 hours
- This week
- Last week
- Last 7 days
- Last 14 days
- This month
- Last month
- Last 30 days
- Last 60 days
- This year
- Last year
- Last 12 months
- Last 24 months
Double click on chart opens Test History window
Status bar shows information related to selected host: IP address, hostname, OS version, protocols supported by target host,
number of test items related to the host.
There are popup menus in upper and lower panes.
Upper pane menu relates to host and group of tests. E.g. you may add new test item related to the host, refresh or pause all items
related to this host, display various information collected from target host. Also you may create your own menu items with
associated commands. For more information, refer to Custom menu profiles section of this manual.
Most commands work similar to same commands available in main HostMonitor window however there are some distinctions:
Add test: when you add new test using Network Map window, HostMonitor automatically sets agent and target host
fields, SNMP Profile for SNMP related tests, etc. Also HostMonitor highlights menu items if target host supports
protocols necessary for such test (e.g. "Add"->"SNMP Get" item will be highlighted when target host supports SNMP protocol).
HostMonitor gray out menu items when target host does not support protocols necessary for the test or such test for target
host already created (e.g. "Add"->"Service test" item will be displayed in gray color when target host does not support
RPC protocol or protocol blocked by firewall); however it does not disable such items so you may create test if you need.
Find operation allows you to find specific host using simple search for IP address or hostname.
Also you may use advanced search with expressions like ("Windows 5" in "%OS%") and ("%WMI%"=="ON")
The following variables can be used for search or clone (copy) operations
| %hostname% | host name |
| %ip% | IP address of the host (IPv4) |
| %os% | OS running on target host |
| %mac_addr% | MAC address (available for systems located within LAN where HostMonitor or RMA installed) |
| %nc_vendor% | network card vendor |
| %snmp% | "on" when host responds to SNMP requests (otherwise "off") |
| %rpc% | "on" when RPC service detected |
| %wmi% | "on" when host responds to WMI requests |
| %type% | when HostMonitor can detect host type this variable returns one of the following values: router, printer,
video, windows, unix, vmware, apple, cisco |
Lower pane menu allows you to operate with specific test items related to the host, e.g. Acknowledge test status,
Edit test properties, Enable, Disable, Refresh or Pause test item, etc. Also you may create your own menu items with
associated commands. For more information, refer to Custom menu profiles section of this manual.
Note: when you add new test using Network Map window, HostMonitor sets fixed IP address (address of the selected host) to tests that "normally" do not have such property - External test, RAS, Active Script, Shell Script and ODBC test. This allows to link such test to specific host on the map. "Tests for host" pane offers 2 menu items for such tests:
- Set fixed IP
- Clear fixed IP
Replicator
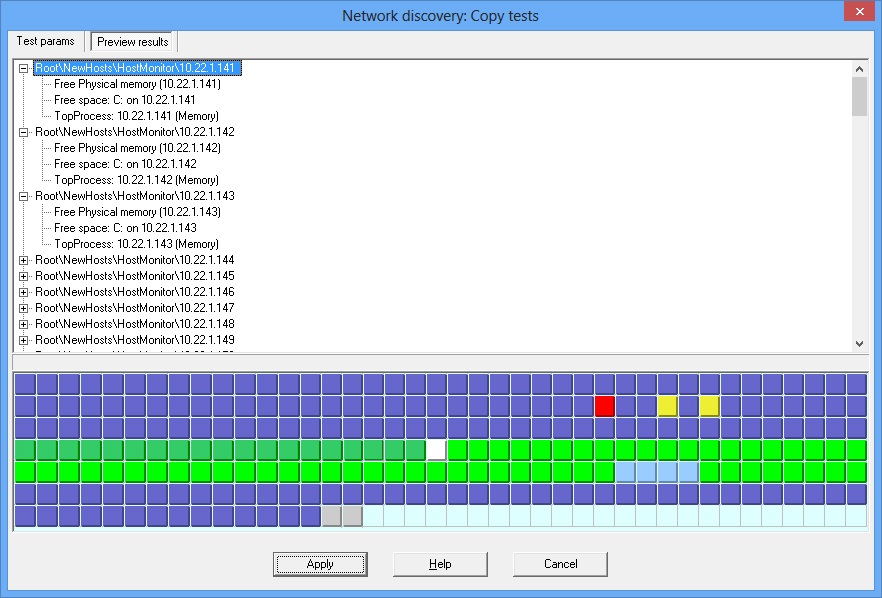
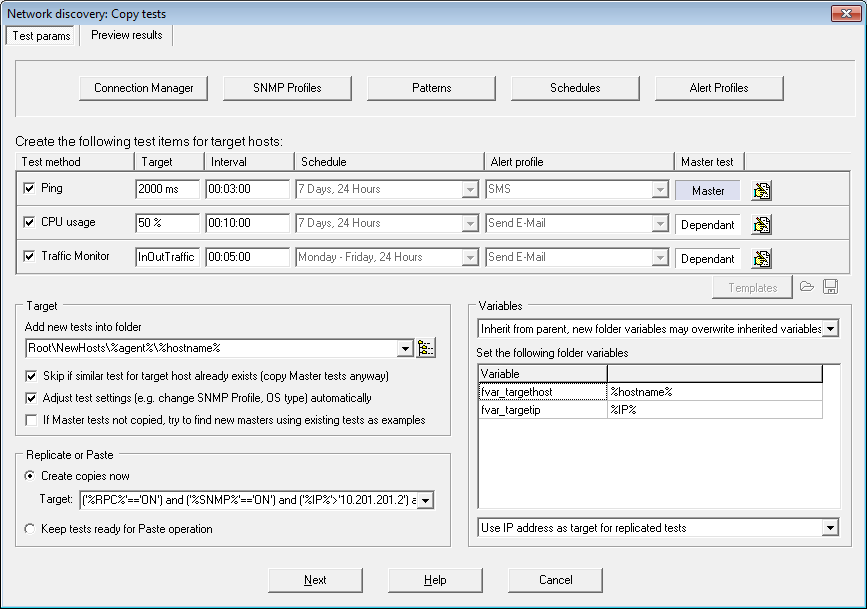
HostMonitor version 10 comes with new built-in Replicator. You may select some host using Network map and choose "Copy" item from popup menu.
"Copy test" window will show all test items related to selected host

Then you can unmark some items, change test parameters and set options for replication process.
Add new tests into folder
This option tells HostMonitor where new tests should be located. Here you can specify static folder name (e.g. Root\MainOffice\) or you may specify folder using variables like Root\NewTests\%Agent%\%IP% - in this case HostMonitor will create new folder for each new target host (%IP% variable represents IP address of the host)
Skip if similar test for target host already exists
With this option enabled HostMonitor will check if similar test, related to target host, already exists and will not create another copy.
E.g. if there is TCP test that checks port 80 on hostA, HostMonitor will not add another TCP test for this port on hostA but it may
add TCP test that checks port 81 (when such test exist in "source" list). Also it will not duplicate tests that check some specific
file, ping tests with the same display and packet size options, and so on.
Note: Master tests (test items that have some dependant items) will be copied anyway.
There are 2 modes for replication:
- Create copy now
- Keep tests ready for Paste operations
Create copy now
Using this mode you should specify target hosts before you close "Copy tests" window. You may type target host name or IP address or use
complex expressions. For example you may tell HostMonitor to replicate selected tests for Windows systems with enabled WMI service
within 10.22.1.50 - 10.22.1.250 IP range using expression like
("%WMI%"=="ON") and ("%IP%">="10.22.1.50") and ("%IP%"<="10.22.1.250")
The following variables can be used in expression
| %hostname% | host name |
| %ip% | IP address of the host (IPv4) |
| %os% | OS running on target host |
| %mac_addr% | MAC address (available for systems located within LAN where HostMonitor or RMA installed) |
| %nc_vendor% | network card vendor |
| %snmp% | "on" when host responds to SNMP requests (otherwise "off") |
| %rpc% | "on" when RPC service detected |
| %wmi% | "on" when host responds to WMI requests |
| %type% | when HostMonitor can detect host type this variable returns one of the following values: router, printer,
video, windows, unix, vmware, apple, cisco |
Then you may preview results, HostMonitor will show network map with highlighted target hosts. You may switch back to
"Test params" page if you want to change something, you may start cloning procedure or you may cancel entire operation.

Keep tests ready for Paste operations
This mode works in different way - when you close "Copy tests" window HostMonitor will keep source tests in internal clipboard.
At any time you may select some hosts using Network Map and select Paste item from popup menu. You may select hosts using current
LAN or you may switch to another LAN and "paste" the same test items, this allows you to copy tests from one LAN to another
(e.g. from LAN monitored by HostMonitor to LAN monitored by Remote Monitoring Agent).
Variables
You may use folder-related variables as parameters of test items (target host, path to the file, etc) and parameters of actions
assigned to these test items. For example you may define %fvar_IP% variable and use this variable for various test
items - specify %fvar_IP% as target address for Ping and Trace tests, use string like http://%fvar_IP%/database/index.cgi as URL
specified for HTTP test, check drive free space using \\%fvar_IP%\driveC path for UNC tests, etc. For details please
check Templates section of the manual.
The following options define how Replicator should setup new folders:
- Set new variables
- Inherit all variables from parent folder(s)
- Inherit from parent, new folder variables may override inherited variables
When 1st or 3rd option is selected you may specify folder-level variables. You may use static values and
you may use macro variables.
For example: if you set the following settings:
- Add new tests into folder: Root\NewTests\%IP%
- Create copies now, target ('%IP%'>='192.168.1.100') and ('%IP%'<='192.168.1.200')
- Set new variables:
- fvar_targetIP %IP%
Replicator will create 100 folders:
Folder path Variables
| Root\NewTests\192.168.1.100 | | fvar_targetIP = 192.168.1.100 |
| Root\NewTests\192.168.1.101 | | fvar_targetIP = 192.168.1.101 |
| ... | | ... |
| Root\NewTests\192.168.1.200 | | fvar_targetIP = 192.168.1.200 |
Note: To add a new variable to the end of the list go to the last existing line and press Down Arrow key. Press INSERT button to
insert a new line. Press CTRL+DEL to remove variable. Press F2 to edit variable.
Note: if target folders already exist, Replicator will not change folders settings so existing test items will not be affected.
Preferably use hostname as target for replicated tests
This option tells Replicator to use target host name for new tests related to the host. If hostname unknown, IP address will be used
Use IP address as target for replicated tests
With this option selected Replicator will use IP addresses for all new tests created by this copy operation.
Cloning process
What exactly happens when Replicator clones test items? This depends on test methods - there are 5 groups of tests:
| 1) RAS, SNMP Trap, ODBC and Active Script tests |
- HostMonitor does not clone such tests
|
| 2) External test and Shell Script |
- HostMonitor will create copy of the tests for each target host;
- If there is IP or host name of the source (host) used in command line or used as parameters of shell script,
HostMonitor will replace this IP/hostname with target host IP address (or hostname) - patterns not used for target copies
|
| 3) Mail Relay, E-mail, SOAP, OPC, HM Monitor |
- HostMonitor will create copy of the tests for each target host;
- set target host IP or host name for each item - patterns not used
|
| 4) URL, HTTP, File related test methods, Performance Counter, Memory, SNMP Get, VM systems |
- HostMonitor will create copy of the tests for each target host;
- set target host IP or host name for each item using patterns when source test uses patterns and destination folder created with correct variables;
|
| 5) other test methods |
- HostMonitor will create copy of the tests for each target host;
- set target host IP or host name for each item using patterns when destination folder created with correct variables (patterns will be used even if source test did not use patterns)*;
|
*For example you want to clone "Ping" test with static IP 10.10.1.5 in address field and you are using fvar_IP %IP%
variable for target folders. Then HostMonitor will create new folders and new Ping tests using %fvar_IP% string in address field.
Unless some folder already exist and such variable does not hold correct IP address (or variable is not specified for this folder) - in
such case static IP will be used for new test item.
Network Discovery and Replication great combination - now it's pretty easy to create thousand new test items for entire LAN or find couple systems
that were not monitored by HostMonitor yet.
System info
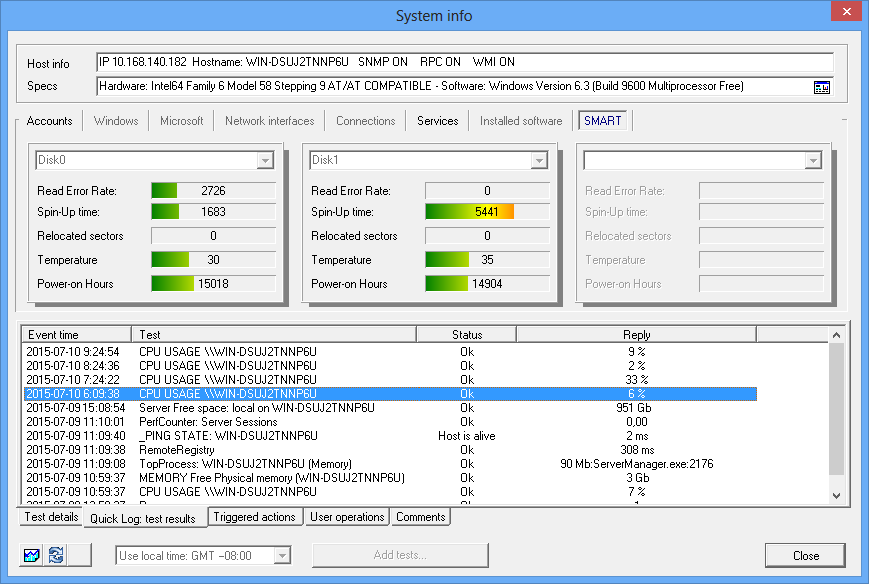
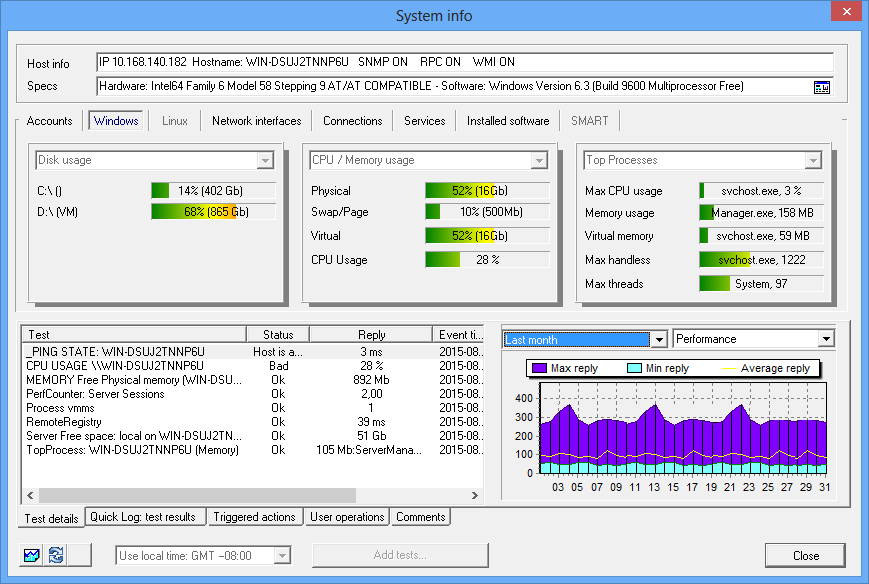
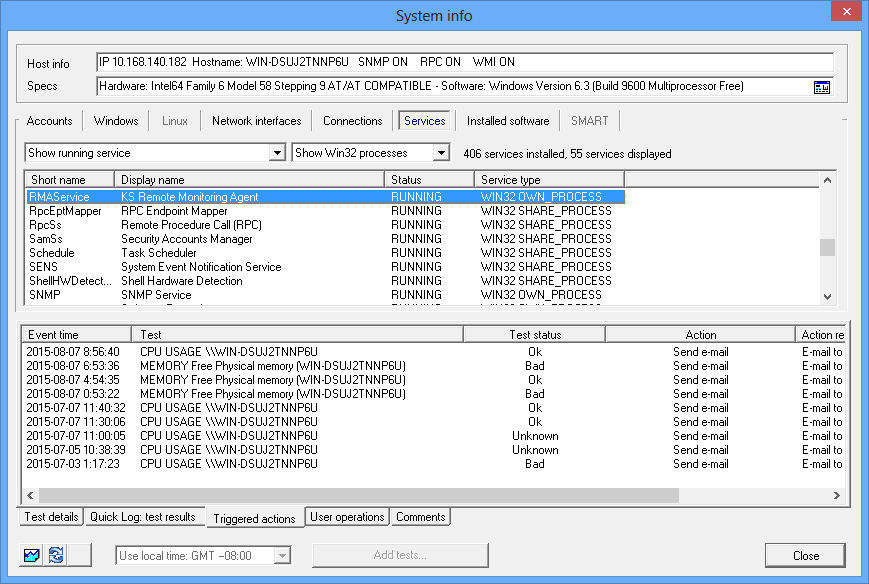
System info function uses various protocols to collect data and shows information related to selected host. It can be called
from main HostMonitor window or from Network Map window using System Info popup menu item.

System Info window may show
- disk, CPU and memory usage on Windows systems;
- disk, memory usage and system load on Unix systems;
- memory usage and system load on some Cisco routers;
- network interfaces on various network devices (including Windows and Unix systems, routers, etc);
- opened TCP ports and established TCP connections;
- Windows services;
- installed software on Windows and Linux systems;
- hard drive status (SMART data) on Windows systems;
- processes that use most of CPU, memory or handles on Windows system
Data can be collected by HostMonitor, Passive or Active RMA for Windows.

Also you may see all test items related to the host regardless where these items located within HostMonitor folders tree.
Quick Log pages show test results and actions related to selected host and so on.
Chart shows performance and/or status related history; double click on chart opens Test History window.
You can perform operations with test items without leaving System Info panel:
- Acknowledge status
- Edit
- Refresh
- Pause
- Resume
- Disable
- Enable
- Check historical charts
- Check private logs (for HostMonitor and RCC connected to local HostMonitor)
Also you may check target host using built-in and external tools, e.g. start the following utilities:
- Trace
- Telnet
- MIB Browser
- WMI Explorer
- Process Meter
Custom menu items can be added as well.

Accounts
When HostMonitor cannot find account related information (used for connection to target system) you can provide
SNMP profile and 2 user accounts manually. When you set new or change user accounts you may store these new accounts
using the following options:
Set accounts to network database
HostMonitor stores SNMP profile and user accounts in database managed by Network discovery utility. Existing test
items are not affected in any way.
Apply to database and ALL related tests
This option stores user accounts in database managed by Network Discovery as well. Also it changes account for test
items related to this host when "Connect as" test property is enabled. Plus this option changes or creates new records
for Connection Manager. It may create up to 6 new records (this may happen when you need to use different accounts for
WMI and RPC related tests and you are using test items with different format of "target" field - host name, IP address
and FQDN) but normally just 1 or 2 records will be modified.
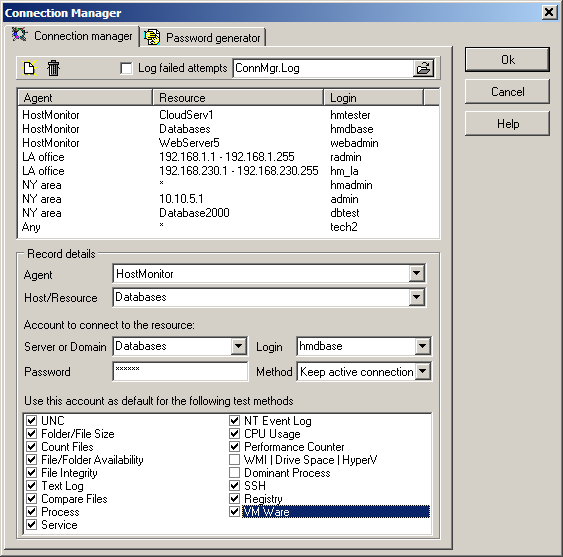
Connection Manager
- Improved logging
- New field "Agent"

There is just 1 new field - agent property allows you to specify Remote Monitoring Agent (or HostMonitor) that will
check target host or LAN.
However this option changed the way HostMonitor chooses account for remote connection:
Step 1
- 1-a) highest priority has record for specific agent and specific resource. E.g. If "Folder Size" test performed
by "NY-agent" checks \\dbase_server5\tables\root\ folder, then HostMonitor will try to find account record with enabled
"Folder/File size" test method for NY-agent with resource field set to \\dbase_server5\tables\root
- 1-b) if such record not found, then HostMonitor checks for account record with the same properties but with agent
field set to "Any" (any RMA or HostMonitor)
Not found? go to Step 2
- 2-a) HostMonitor will try to find account record with enabled "Folder/File size" test method for NY-agent with
resource field related to target host (e.g. \\dbase_server5\tables or dbase_server5 will match)
- 2-b) if such record not found, then HostMonitor checks for account record with the same properties but with agent
field set to "Any"
No such records? go to Step 3
- 3-a) HostMonitor will use IP address of target system to check for appropriate record (resource for specific
IP or IP range) specified for "NY-agent"
- 3-b) if such record not found, then HostMonitor checks for specific IP or IP range specified for "Any"
If there is no record for target host, go to Step 4
- 4-a) Get "default" account (resource specified as *) for "NY-agent"
- 4-b) Finally (lowest priority), use "default" account specified for "Any"
So, now we have 8 priority levels.
Note: If you provide some account just for primary agent and primary RMA agent fails and there is backup agent installed, same account will be used
RCC improvements
- Remote Control Console version 5 supports new features:
- Network discovery
- Network Map
- Replicator
- System info
- New Connection Manager
- RCI Status window (menu View->RCI status) shows list of remote operators that are currently connected to the HostMonitor,
connection log, recent commands and statistics. With the buttons in the right panel of the window you may change RCI settings,
manage user's accounts, send message to any RCC operator and disconnect RCC clients.
When RCC client receives text message from another operator, it shows "green" popup window. Operator may close this window or keep window on screen and
continue working with test items and profiles as usually.

When admin selects some RCC client and clicks "Disconnect" button for the first time, RCC client will not be disconnected immediately.
HostMonitor will mark this client as "disconnecting" while RCC operator will see "red" popup window with countdown timer and "I need more time" button.
Operator may click (once or several times) on "I need more time" button and reset timer to 60 sec. Otherwise client will be disconnected in 15 seconds.
When admin clicks "Disconnect" button 2nd time (for the same RCC client), RCC will be disconnected immediately.

- If RCC connected to HostMonitor locally, you may view private logs used by selected test items. "View private log" menu
item available for System Info, Network Map, Super Matrix windows and main window
- When you start WMI Explorer application to check some specific host (e.g. using popup menu for selected test item, Test
Properties dialog or Network Map), RCC may retrieve account information from Connection Manager and pass account to WMI Explorer
(just like HostMonitor does)
- When you start Process Meter application to check some specific host (e.g. using popup menu for selected test item or Test
Properties dialog or Network Map), RCC may retrieve account information from Connection Manager and pass account to Process Meter
(just like HostMonitor does)
- "Generate reports now" function (available in Folder Properties, View Properties and Options windows) sends request to
HostMonitor so at any time it may create SLA reports with up to date data (in version 9 SLA reports should be generated by
HostMonitor GUI, by built-in scheduler or special actions)
Web Service
- Small interface improvements related to Test Info window
- New Web Service comes with OpenSSL version 1.0.2c
- Several new "undocumented" options allow you to disable SSL 3.0 and TLS 1.0 algorithms. "Undocumented" means the option is not accessible thru GUI however you may add lines like
DisableSSLv3 = 1
DisableTLSv1 = 1
into [SSL] section of webservice.ini file and restart Web Service (in order to apply changes). These commands will disable SSL 3.0 and TLS 1.0
- Also you may use DisableDES, Disable3DES, DisableIDEA, DisableMD5, DisableSHA1, DisableSSLv2 and DisableExport40 commands
MIB Browser
- Get Row function (available in SNMP Get window) - retrieves entire row from a table, e.g.
GetRow for OID 1.3.6.1.2.1.2.2.1.2.1 will provide list of ALL network interfaces installed on target system
- Get Next function (available in SNMP Get window) - now it allows to adjust number of items in 1 request. E.g. each request may retrieve 5 next items
- Minor GUI improvements
Improved test methods
- Traffic Monitor test: some CISCO routers provide "interface number" counter with invalid value. Now HostMonitor can process data from such devices and perform Network Traffic tests
- Count Files test can filter files by size usign GB units
- Certificate expiration test can choose correct certificate on servers that host many different domains (webservers) on 1 physical server
- Minor changes for CPU Usage test - test should work better when HostMonitor needs to check many Windows systems at the same time
- WMI test: you may specify [:x32] or [:x64] suffix for name space parameter. E.g. root\cimv2[:x64]
This option requests WMI to load a non-default provider (32-bit provider or 64-bit provider).
Note: Windows 8.1 and Windows 2012 works incorrectly - using this option in one application (e.g. HostMonitor) may effect another applications. If you run some other WMI related software on the system, then use [:x32] option with care.
- VM host free space test: new "Datastores" option allows you to check some specific datastores. You may specify single datastore to check;
select datastores from the list or provide comma separated list. If you keep this field empty or type * then HostMonitor will check ALL available stores and find the store with minimum free space (just like version 9.90)
- VM host free space test: decodes non-ASCII (UTF8) volume names
- VM host status test: "check sensors" option could not work on some VMWare ESXi hosts version 4.1. Fixed
- VM guest CPU usage test could not check some Hyper-V systems when "skip guest" option enabled. Fixed
- E-Mail test could decode some time zones incorrectly. Fixed
Improved actions
- Run External program actions: run in current active session option
- Run External program actions: working directory option
New operators and variables
- New operators can be used for Optional status processing
| getnumberwithdot |
Usage <string> getnumberwithdot <num>
This operator ignores all words within <string> except integer numbers and numbers with the period, returns number #num and then replaces the period character with system decimal separator (so it may replace the period with comma when system decimal separator is the comma).
Example
('wordA wordB 21.10,15.00' getnumberwithdot 2)=='15.00'
('wordA wordB 21 15.00' getnumberwithdot 2)=='15.00'
(returns '15,00' when system decimal separator is comma)
|
| getnumberwithcomma |
Usage <string> getnumberwithcomma <num>
This operator ignores all words within <string> except integer numbers and numbers with comma, returns number #num and then replaces comma with system decimal separator (so it may replace comma with the period when system decimal separator is the period).
Example
('wordA wordB 21.10,15.00' getnumberwithcomma 2)=='10,15'
('wordA wordB 21 15.00' getnumberwithcomma 2)=='15'
('10,15' will be replaced with '15.10' when system decimal separator is the period)
|
| getnumber |
Usage <string> getnumber <num>
This operator ignores all words and symbols within <string> except integer numbers, returns number #num
('wordA wordB 21.10,15.00' getnumber 2)=='10'
('wordA wordB 21 15.00' getnumber 2)=='15'
|
- New SNMP Table test related variables return all values retrieved from SNMP agent (just values without corresponding OIDs)
| %SNMPTABLE_VALUES% | Shows entire table retrieved from SNMP agent |
| %LASTSNMPTABLE_VALUES% | Shows SNMP table retrieved by previous test probe |
| If "Apply filter" test property is enabled, HostMonitor may skip some items from the table (e.g. you may skip all network interfaces with zero incoming traffic). The following variables allow you to display SNMP table without showing these items |
| %SNMPFILTEREDTABLE_VALUES% | Shows table retrieved from SNMP agent (only items that passed filter) |
| %LASTSNMPFILTEREDTABLE_VALUES% | Shows table retrieved by previous test probe (only items that passed filter) |
- %AlertThreshold% and %AlertThresholdValue% variables can be used for Traffic Monitor related items - variables represent "alert if" condition specified for the test item (condition that tells HostMonitor when it should set "Bad" test status).
| %AlertThreshold% | returns string like "500 MB/sec" |
| %AlertThresholdValue% | returns number, it converts any units specified for test item threshold to Kbit/sec or pkt/sec units. If %AlertThreshold% returns "500 MB/sec" then %AlertThresholdValue% will return 4096000 |
- Small modification related to %DISKID%, %DISKLABEL%, %DISKFREEPERCENT% and %DISKFREESIZE% variables - if variable used as parameter of some action triggered by test different from Drive Free Space, it returns empty string
- %ip4% variable represents IP address of the host checked by the test item (also %ip% variable can be used). Variable can be used for:
- optional status processing expressions
- action parameters
- custom fields
- views (when "select item using expression" option is selected)
- custom HTML reports
Other improvements
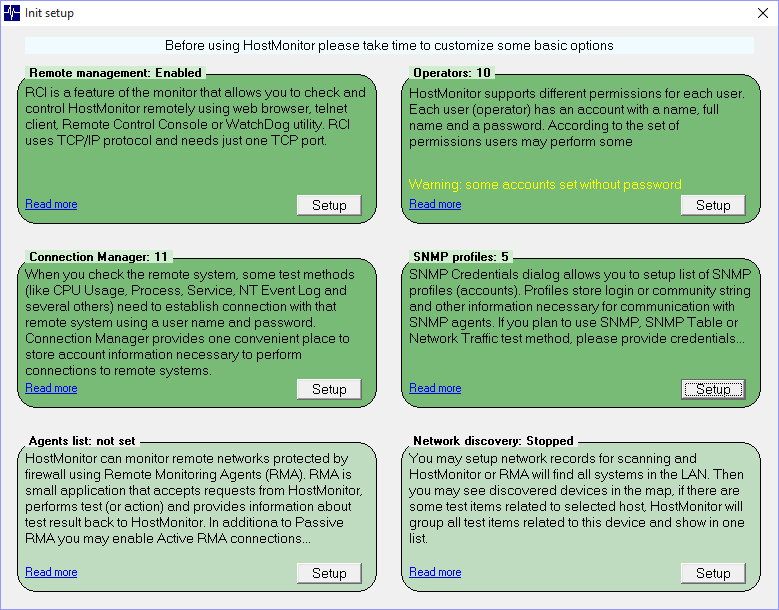
- HostMonitor: new initial setup Wizard helps new users setup important parameters

- HostMonitor comes with OpenSSL 1.0.2c
- HostMonitor/RCC: operators with "View test settings (readonly)" permission can view test settings (as before) plus they can view Shell Script tests even if "Manage ShellScripts" permission is not assigned (but they cannot view script code without this option)
- HostMonitor/RCC: Network Interfaces dialog: decodes non-ASCII descriptions
- HostMonitor/RCC and Web interface: if operator adds 2nd or 3rd acknowledgment comment then GUI shows last comment line (GUI shows 1st line for single comment)
- Log Analyzer: works with large numbers in Reply field
The following issues were resolved
HostMonitor
- SNMP Get test: import from text file did not process "doesn't contain" option correctly
- SNMP Trap test: import from text file did not process "doesn't contain" filter option correctly
- Actions triggered by UNC test: %AlertThreshold% variable displayed incorrect values for units over 2TB
- GUI: Test Properties dialog -> Performance Counter test -> Select a counter to monitor: this dialog window
could return empty string instead of selected counter on Windows 8, Windows 8.1 and Windows Server 2012 systems
- Minor HTML corrections for SLA reports
- Connection Manager did not connect to remote system when file related tests use (*) or (?) wild card in filename
- HostMonitor resetted "Pause alerting till" option after restarts
Web Service
- Corrected encoding for datetime field in QuickLog and Actions QuickLog panels (e.g. Datetime fields could be displayed incorrectly on systems with Chinese regional settings)
- Web interface could display user account name specified for URL test. Removed for security reason
RMA for Windows
- Agent started on Windows Server 2012 or Windows 10 reported wrong OS version to RMA Manager
|
| |
Archive:
versions 9.00 - 9.90
versions 8.00 - 8.86
versions 7.00 - 7.78
versions 6.00 - 6.82
versions 5.00 - 5.92
versions 4.00 - 4.86
versions 0.80 - 3.71

Copyright (c) 2000-2017 by Advanced Network Software. All Rights Reserved
| |

