|
 |
|
|
| | What's New |
| | |
|
|
 Improvements Improvements
- HostMonitor: Test Info dialog shows detailed temperature/voltage map for Cisco Temperature and Cisco Power test items
- HostMonitor: some customers assign "Send E-Mail" action to all tests using folder and test related variables as recipient address (e.g. %CommentLine5%; %FCommentLine2%; %fvar_AdminMail%)
and leave these variables uninitialized for some folders and test items. In such case resolved e-mail address may look like semicolon-separated list of empty strings (e.g. ";;"),
then HostMonitor 11.98 will not connect to mail server and will save some CPU resources.
- HostMonitor: minor improvements related to nested macro variables used as parameters of the actions
 The following issue was resolved
- WebService: some corrections related to "multi-byte" languages such as Japaneese, Chineese, Korean (versions 11.90-11.97 were affected)
|
|
|
Performance improvement
- Passive RMA and Active RMA agents can be updated by RMA Manager faster (useful when you need to update 100 or more RMA agents).
You will see some improvement when new RMA Manager will update old agents. Then it will work even better: new RMA Manager + new RMA agents
Several issues were resolved
- RMA running on Windows Server 2019 could reject updates received from RMA Manager. Fixed in this version
(note: if old agent rejects update, you will need to update such agent manually - just copy new rma.exe file)
- HostMonitor and RCC GUI related corrections
|
|
|
Performance improvements
HostMonitor, RCC
- Auditing Tool works faster
- Telnet service decodes data faster
- Export into text file function works faster
- RCC uses less memory when creates SLA reports
- With some options set "Disable tests" operation could be too slow, now it works faster
(probably you will not notice improvements if your monitoring setup includes just 1000 test items; while improvements will be clearly noticed when you need to export or disable 80,000 test items located in 10,000 folders)
Test improvements
- URL test: improvements help to retrieve large web pages (or files) when you have to deal with slow network connection or busy target server (note: by default HostMonitor downloads first 96MB of the file)
- HTTP test: optimized code uses less CPU when you need to check large files (note: by default HostMonitor downloads first 96MB of the file)
- Interbase test can monitor FireBird SQL servers as well; HostMonitor can use gds32.dll and fbclient.dll client DLLs.
Also Interbase/Firebird test allows using non-standard TCP port for connection
- MySQL test can monitor MariaDB servers as well; it can use libmySQL.dll and libmariadb.dll client DLLs.
Note: libmySQL.dll from MySQL Connector v8 is not supported yet; libmySQL.dll version 5.x can be used for connection to MySQL v8 but
in this case you have to create a user account using mysql_native_password plugin (because default MySQL v8 caching_sha2_password
authentication is not supported by MySQL 5.x)
- ODBC Query test / SQL Query action / ODBC logging: we think there is bug in MySQL ODBC drivers version
8.00.11 - 8.00.15, it may lead to various problems including memory access violations. There is workaround in HostMonitor 11.96.
If you need to use MySQL ODBC driver version 8.x, please set two options in hostmon.ini file, [Misc] section:
[Misc]
ODBC_UseSharedEnvHandle=1
ODBC_KeepSharedEnvHandle=1
New folder-level variables
| %FolderCurrent_TotalProbes% | number of test probes executed since last statistics reset |
| %FolderCurrent_SessionProbes% | number of test probes executed since HostMonitor restart |
| %FolderRecursive_TotalProbes% | number of test probes executed since last statistics reset, counts test items within folder and all subfolders (not applicable to Custom HTML reports) |
| %FolderRecursive_SessionProbes% | number of test probes executed since HostMonitor restart, counts test items within folder and all subfolders (not applicable to Custom HTML reports) |
Other
- HostMonitor, RCC and WatchDog show warning icon (in addition to logging) when HostMonitor unable to save test list for some reason (e.g. access is denied)
|
|
|
|
|
|
|
Performance improvements
HostMonitor, RCC
- much faster Log Viewer; also it uses less memory
- about 5% faster HTML reports
- 20-50% faster Custom HTML reports (depends on report template, number of fields, etc)
- 60% more efficient External Syslog function
Log Analyzer
- faster Quick Chart
- much faster loading and analyzing of large files (DBF, TXT and HTML)
- much faster reports generation (some but less speed increase for reports with charts)
- faster main window GUI (in case you have 50,000 or more log records for each test item)
Note: as usually you will see the slowest GUI on Windows 10
Web Service performance
GUI improvements (HostMontor, RCC)
Log Viewer improvements
- it works much faster
- uses less memory
- may open files of any size (but shows just last 2GB of logs)
- checks for new records and shows them without reloading entire file
- new "Filter" function allows you to display records based on date, status, test ID, test name or reply value
- new "Copy selected" option
Top Hosts window
| Added new groups: |
| - Net: Highest traffic | Traffic Monitor tests |
| - Web: Highest traffic | Appache, Tomcat, IIS tests |
| - Web: Highest error ratio | NGINX, Tomcat and IIS tests |
| - Web: Lowest cache hit ratio | NGINX "cache hit ratio" and IIS cache related tests |
| - System: Hottest system/CPU | QNAP, Synology, NetApp, Cisco, Juniper and HP iLO Temperature tests |
| - HDD: Highest disk load | Synology Disk Load and Windows Performance Counter ('% Disk Time') tests |
| - UPS: Highest load | UPS Load tests |
| - UPS: Highest temperature | UPS Temperature tests |
| - UPS: Lowest charge level | UPS Charge tests |
| Improved groups: |
| - HDD: Hottest disk | includes QNAP Temperature, Synonoly Temperature and HDD Smart tests |
- System: Lowest disk space
- System: Lowest disk space (%) |
Drive Free Space and UNC tests included. New version checks all test items, regardless of the test mode: check space in MB/GB units or check percentage of available disk space. HostMonitor converts values when necessary (not in "average reply" mode - this mode works the same way as before) |
Other Top Hosts improvements
- New popup menu items "Show test name" and "Show host name" tell HostMonitor to display test name or target host name (or IP address)
- Also HostMonitor may adjust long test names trying to fit text in the window, for example it can remove "free disk space" text from the test name when test displayed in "System: Lowest disk space" group)
Views
- Views related to Root folder displayed Template test items. Now View shows template tests only if View source folder is Template folder
Test details
- Min reply/Max reply/Average reply fields show units (e.g. Kbit/s, MB/s, TB)
- Min reply/Max reply fields do not round off small values (old version displayed 0 instead of 0.01)
Quick Log pane
- new menu item "Save current mode as default"
Some changes in sorting by Reply field algorithm.
There are the following groups of tests, sorted separately:
- tests that display response time (ms), e.g. Ping, URL
- traffic tests (Kbit/s..GB/s), including Traffic Monitor, Apache, IIS, Tomcat (when one of traffic check modes selected)
- percentage (%), including CPU Usage, Memory, Drive Free Space tests
- tests with text reply
- numbers, numbers with units (like MB,GB,TB), items grouped by units, then sorted by values
- uptime tests (days), sorted by number of days
- tests with numbers and V, kV, C, F units (some devices may return such data over SNMP protocol; also you may set such units using "Tune up Reply value" option)
GUI improvements (Web Service)
- Views related to Root folder displayed Template test items. Now View shows template tests only if View source folder is Template folder
- Min reply/Max reply/Average reply fields show units (e.g. Kbit/s, MB/s, TB)
- Min reply/Max reply fields do not round off small values (old version displayed 0 instead of 0.01)
SLA reports improvements (HostMonitor, RCC)
HTML SLA reports
- show units (like MB/s) for Max Reply, Min Reply, Average fields
- may show units in Folder Summary line, may convert units depending on tests, e.g. if there are various Traffic Monitor tests using different units (Kbit/s, MB/s) then Folder Summary section will display summary values using KB/s units
- may show units in Section Summary line, works similar to Folder Summary
XML SLA reports
- these reports were not changed: no unit translations for "summary" sections, always use KB/s for Traffic Monitor test results
Test improvements and corrections (HostMonitor, RMA for Windows)
- Apache test: supports Apache XAMPP
- IIS "cache hits ratio" tests set 0 if IIS service was restarted between test probes. New version shows average cache hits ratio value in such case (average value counted since IIS restart)
- IIS tests "bytes transferred/sec", "bytes received/sec" and "bytes sent/sec" could show wrong results in some cases. Fixed
- NGINX "requests/sec" and NGINX "ssl handshakes/sec" tests could show wrong numbers (only once after NGINX server restart. Only when new RestAPI used, NGINX R14+). Fixed
- NGING "5xx error responses ratio" and NGINX "total error responses ratio" tests could show wrong numbers (only once after NGINX server restart) Fixed
- NT Events Log test (Windows Vista mode, "Connect as" option): now you may specify account in both formats: domain\user or user@domain. Old version required user@domain format. Note: Connection Manager is still preferable option in most cases
- SNMP Get and SNMP Table tests allow to set up to 180sec timeouts (instead of 60sec max before)
- Shell Script test: %Object2% variable could return incomplete string. Fixed
- Folder/File Availability test in SFTP mode set Unknown status when specified file does not exist. Now test sets Ok or Bad status depending on test settings (like FTP and FTPS modes)
- Traffic Monitor test: added Gbit/sec, GB/sec options. You may specify threshold using Gbit/GB units and HostMonitor will display results using same units. Also you may use Gbit/sec, GB/sec units in HMScript (SetTestParam and ReplaceTestParam commands)
- Traffic Monitor test: results include time units (e.g. Kbit/s or MB/min). This way results can be precisely compared and log files can be analyzed correctly even if test settings and units changed during monitoring.
- Traffic Monitor test: historical variables (like %StatLastWeek_AverageReply%, %Stat30Days_MaxReply% show traffic using Kbit, KB..GB units (as before) unless /min option was used for the test - then variables display units like Kbit/min, MB/min
- Traffic Monitor, Apache, IIS and Tomcat tests: Min, Max, Average Reply counters did not count units (KB/s, MB/s, etc). Fixed
HostMonitor: other changes
- Some corrections related to daylight savings time change
- Minor improvements related to ODBC logging
- Minor changes related to DBF and HTML log files
Log Analyzer improvements
New version works much faster however 2GB file analyzing can take 1-3 min (depends on file format, number of test items, system performance, etc). So we added some new options that may save time even more.
- onetest command line parameter tells Log Analyzer to find and analyze one or several tests and ignore other
test items. You may specify test ID, list of test IDs, full name of the test or text with wildcard (wildcard should be located at the beginning or at the end).
Examples
| -logfile:log.txt -onetest:105 | Analyze records related to test with ID 105 |
| -logfile:log.txt -onetest:105,106,107 | Analyze tests with ID 105, 106 and 107 |
| -logfile:log.txt "-onetest:Ping 10.10.1.5" | Analyze test named Ping 10.10.1.5 |
| -logfile:log.txt "-onetest:Cisco*" | Analyze test items with "Cisco" string in test name or test method |
| -logfile:log.txt "-onetest:*temperature" | Analyze test items with "temperature" string in test name or test method |
When you are using HostMonitor or RCC GUI to analyze log file for specific test, HostMonitor (RCC) checks log file size and applies "onetest"
switch for large files, this way Log Analyzer will load log file much faster.
You may adjust limit for such "large" files using MinLogSizeForSingleTest parameter in [Misc] section of hostmon.ini (or rcc.ini) file. For example
[Misc]
MinLogSizeForSingleTest=100
sets 100 MB limit. If you set 0, then "onetest" switch will not be used.
- When Log Analyzer started without "onetest" switch and its not started in scripting mode then
application checks number of records in the file. If there are over 2,000,000 records, it asks "would you like to load last 500,000 records?"
so you may choose: load and analyze recent log records or read entire log file. You may adjust these limits using logsman.ini file. For example
[LogAnalizer]
MaxRecordsWarn=8880000
LastRecordsCnt=444000
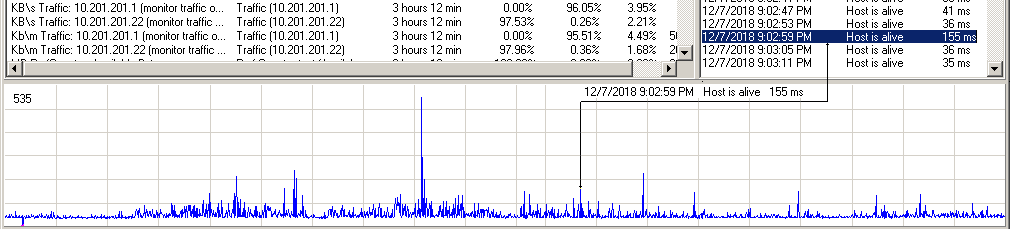
Full screen chart
- Logarithmic mode can be useful when test results are very close in values; or on the contrary, when results cover a large range of values (you may set this mode using popup menu)
- When a lot of records selected for the test (over 7,000) then chart may automatically switch to
"Display average on daily basis" or "Display average on hourly basis" mode depending on selected time interval and number of records
Quick Chart
- Increased speed
- Logarithmic mode: this mode can be useful when test results are very close in values; or on the contrary,
when results cover a large range of values (you may set this mode using popup menu)
- Average mode: if there are thousands of records in the log for the test, then each point on the chart may
represent several log records. Average mode tells application to calculate and display average test result for each time interval (point).
Otherwise chart will show minimum and maximum value for each time interval. You may set Average chart mode using popup menu
- Interaction with test related log
On left mouse click Quick Chart may show log record related to the selected point. If you click on displayed label, Log Analyzer will scroll test related log to this record.
When chart shows thousands of records application helps you to find "points of interest":
- when you just click left mouse button, Quick Chart will try to find nearest point with minimum or maximum test result. Behavior depends on test method, for example:
- Memory tests, Drive Free Space, UNC, VM host free space, VM guest free space, VM host memory, VM guest memory, UPS Charged, UPS Time Remaining tests - Quick Chart will look for local minimum;
- CPU Usage, Temperature tests, Dominant Process, Ping, TCP, URL, HTTP and for many other tests application will look for local maximum;
- for some tests (like Performance Counter, SNMP Get, SNMP Table) Quick Chart will look for nearest local minimum or local maximum
- when you move mouse with button pressed, Quick Chart will show log record related to new selected point, exact point.
However if there are thousands of records in the log for the test, then each point on screen may represent several log records
(one point on chart represents some time interval). In this case application selects log record with minimum or maximum value
(depending on test method) related to the point.
If you set "Average" chart mode, then you may see difference between logged test result and the chart - chart will show average value
for some time interval while text label will show minimum or maximum result for the same time interval
Other changes
- Much faster reports generation (some but less speed increase for reports with charts)
- Filter dialog: on multi-display systems Date picker control could show calendar on another monitor. Fixed. Also, new version always uses system date format for calendar, regardless of settings used for log file analyzer
- Statistics: now Log Analyzer does not round off even large Min and Max test values when these values are close, e.g. 10200.01 and 10200.03
- Statistics: Min, Max, Average Reply fields display units for test methods like Traffic Monitor, Top Process, Apache, Tomcat, IIS
- A lot of other minor improvements
|
|
|
Test improvements
- NGINX test supports new NGINX Plus R15 Rest API (old HostMonitor will not be able to monitor NGINX Plus R16 and newer versions)
- HostMonitor and RMA for Windows: Certificate Expiration test offers "Use StartTLS" option, this option allows to check SMTP servers that work in Explicit mode
- HostMonitor and RCC: Import function supports test parameters like
MasterTestID-Alive = 2
MasterTestID-Dead = 3
MasterTestID-DeadOrUnknown = 55
such command tells HostMonitor to finds Master test by ID.
Note: Master test must exist in current test list, before import (unlike MasterTest-Alive, MasterTest-Dead commands that may find Master in current test list AND in the import file)
Log Visualizer improvements
- New version processes log files much faster
Improvements related to Templates
Probably you already have set of tests located in some folder and used as templates for new items. Now you may mark such folder using popup menu "Set as templates". Note: only one folder (with all sub-folders) can be used for templates.
New version of HostMonitor applies more special rules related to templates:
- HostMonitor uses special color for template folders and tests (you may adjust palette using Color Profiles dialog)
- HostMonitor uses special icons for template test items
- HostMonitor does not perform template test items so now you don't need to disable such items and then enable newly created items after replication
- License check does not count template test items. if you have Advanced license you may monitor 5000 "normal" test items plus setup hundreds of template items at no additional cost (this is especially useful when you have the simplest Starter license)
- "Append from HML file" function merges "normal" folders and separately merges template folders
- Auditing Tool does not check template test items for unresolved folder-level variables (HostMonitor will check for unresolved variables when you create "normal" tests using templates)
- Auditing Tool checks if "normal" test depends on template master item (you should not set such relations because test will not be performed)
- HostMonitor does not include template folders and tests into reports (unless template folder is selected as main folder for the report)
- HostMonitor does not show template folders and tests on screen (even if "show tests in sub-folder" option is enabled and Root folder selected), unless you choose Template folder as current folder
- When you choose Master test for "normal" dependent item, HostMonitor will not show Template tests in the list
- Web Service does not show Template folders and tests on screen (even if "display tests from current folder and from all sub-folders" option enabled and Root folder selected), unless you select Template folder as current folder
- Many other minor modifications
Special folders
You may create any sub-folders within main Template folder. If you create sub-folder with one of the following names, then HostMonitor will add corresponding menu item into main menu (Tests->New) and into "Add" popup menu:
Lan Email
Web
IIS
Apache
Nginx
Tomcat
Windows
Unix
VMWare
HyperV
HP iLO
SNMP
External
Cisco
Juniper
Netapp
QNAP
Synology
UPS
Files
Interbase
MsSql
MySql
Oracle
Postgre
Sybase |
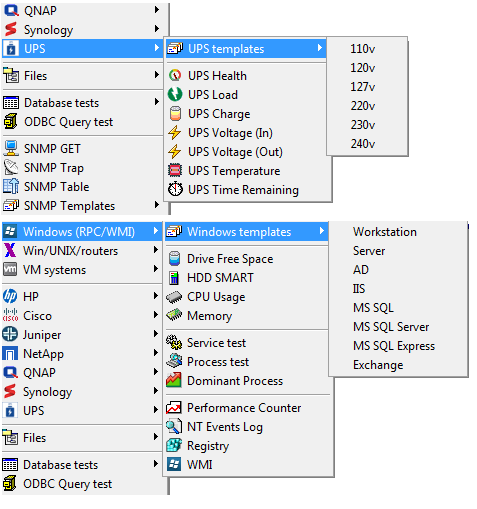 |
When you use such menu item, HostMonitor will show all tests related to the corresponding template folder.
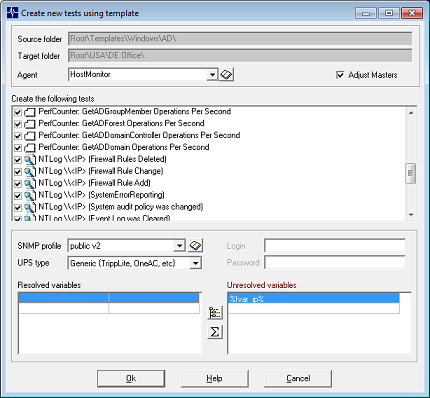
Then you may unmark some tests, change monitoring agent, set SNMP profile for SNMP related tests, change type of UPS device (for UPS related
tests), set login and password for tests that require account information (see also: Connection Manager).
If some test depends on master(s), HostMonitor checks if master template test items selected and shows warning if such items located in different
template folder or master test is unmarked by operator. Also HostMonitor checks if all variables will be resolved after replication - if
there are some missed variables, you may define variables using Folder Properties dialog.
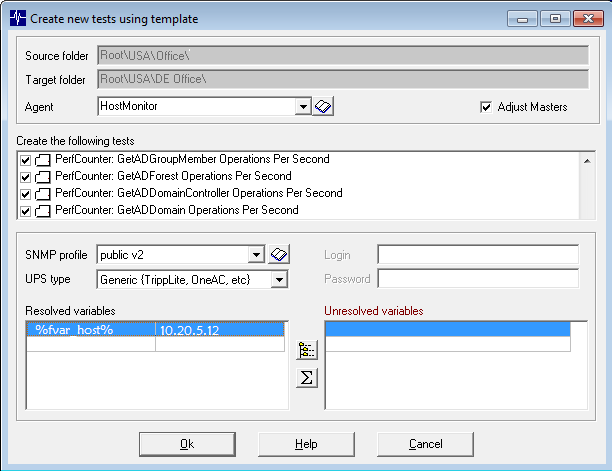
Also there is "Adjust Masters" option. With this option enabled, if dependent tests copied with master(s) then HostMonitor adjusts master-dependant relations for newly created tests. E.g. if you copy 6 tests (5 UPS tests that depends on 1 Ping test) then new UPS tests will depend on new Ping test (if you are using folder-related variables for target IP address, then new tests will start to monitor new device without any manual adjustments).
If you create just dependent tests without related master template test, then HostMonitor will unlink newly created (replicated) dependent tests from this "missed" master.
Predefined templates
HostMonitor comes with some predefined templates: over 600 items for Windows and UNIX systems, Cisco, Juniper, QNAP, NetApp and Synology devices,
HP servers, MS SQL, MySQL, Oracle databases and so on. You may adjust items for your needs (e.g. set alert profiles, change time interval,
schedule and logging options, adjust alert), adjust alert thresholds, add more folders and test items or remove them.
Many template tests will be able to monitor your servers without modifications - just create folder, setup %fvar_ip% variable (IP address
or host name of the server) and you may add set of tests using templates;
some tests require user account information, you may provide default account or accounts for each server using Connection Manager;
other template tests will require modifications, e.g. if you need to check database size, you need to set database name in SQL query
(ODBC Query tests); also you may need to modify class name used in MS SQL related WMI queries.
Update
If you already use your own templates, you have several options:
- remove default templates that come with HostMonitor (remove Templates folder) then select your main template folder and use "Set as Templates" popup menu item;
- you may merge our templates with your items - simply drag&drop your folders (or some selected test items) into Templates folder
Probably your old template test items are disabled? You may enable test items - now HostMonitor does not execute template test items.
Save Templates as default
This menu (File -> Save Templates as default) tells HostMonitor to save all template folders and tests into special file (deftemplates.lst). If you load some old testlist (HML file) without templates or create new test list, then default templates will be added to the list automatically.
(option not available for remote RCC operators)
The following issue was resolved
- Append from HML file function could import tests that depend on expression incorrectly. Fixed
|
|
|
GUI improvements
- Copy folders: "Adjust Masters" option
If you copy folders with test items, you may use new option "Adjust Masters". With this option enabled, if dependant tests copied with
master(s) then HostMonitor adjust master-dependant relations for newly created tests. E.g. if you copy 6 tests (5 Cisco tests that
depends on 1 Ping test) then new Cisco tests will depend on new Ping test (if you are using folder-related variables for target IP
address, then new tests will start to monitor new device without any manual adjustments).
- New "Check and copy" function
You may select set of tests, click on "Check and copy" popup menu item and select target folder.
Then you may change some parameters, e.g. change monitoring agent, set SNMP profile for SNMP related tests, change type of UPS device
(for UPS related tests), set login and password for tests that require account information (see also: Connection Manager).
If you are copying "template" tests and some of them depend on master(s), then HostMonitor checks if master template test items
selected as well. Also HostMonitor checks if all variables will be resolved after replication - if there are some missed variables,
you may define variables using Folder Properties and User Defined Variables dialogs.
Adjust Masters option - with this option enabled, if dependant tests copied with master(s) then HostMonitor adjusts
master-dependant relations for newly created tests. E.g. if you copy 6 tests (5 UPS tests that depends on 1 Ping test) then
new UPS tests will depend on new Ping test (if you are using folder-related variables for target IP address, then new tests
will start to monitor new device without any manual adjustments).
If you copy just dependant tests without related master test, then HostMonitor will either
- unlink newly created (replicated) dependant tests from this "missed" master (if master is "template" test)
- keep dependency on original master test (if master tests are "normal" test items)
If you want to copy test items without any checks and modifications, use "Copy" function.
Note: Network Map Replicator offers more options, like
- Skip if similar test for target host already exists
- Adjust test settings automatically
- If Master tests not copied, try to find new masters using existing tests as examples
- Remote Control Console supports Views based on expressions with historical variables like '%STAT60DAYS_DeadRatio%'
(e.g. '%STAT60DAYS_DeadRatio%'>5)
- RCC: If you are creating SLA reports for a large amount of tests (e.g. 20,000 tests) on remote system using Remote Control Console,
new version will get historical data from HostMonitor and create SLA reports much faster.
Test improvement
- Mail Relay test supports secured and encrypted connections (SSL/TLS) to SMTP servers. You may set "None" option to use unencrypted
connection, select "Implicit" or "Explicit" (StartTLS) to use encrypted connection (such options for POP3 and IMAP servers where implemented years ago)
Action improvements
- Stop service
- Start service
- Restart service
These actions support comma separated lists (or LF separated) and can stop, start or restart many services, one by one. E.g.
you may use %Reply% variable for action triggered by Service test that checks ALL "Auto" services.
- HMScript action
CopyAllTests command supports new optional parameter "-adjustmasters". With this option enabled, if dependant tests copied with master(s)
then HostMonitor adjust master-dependant relations for newly created tests. E.g. if you copy 6 tests (5 NetApp tests that depends on 1
Ping test) then new NetApp tests will depend on new Ping test (if you are using folder-related variables for target IP address, then
new tests will start to monitor new device without any manual adjustments).
Telnet
- Telnet command CopyAllTests supports new optional parameter "-adjustmasters", works similar to CopyAllTests HMScript command (see above).
The following issue was resolved
- Generate reports action: "Use reports pool" option could work incorrectly and sometimes did not create reports
|
|
|
Improvements
- HMScript: new parameters for SetTestParam, ReplaceTestParam, SetTestParamByID and ReplaceTestParamByID commands:
- Threshold (also ThreshouldUp can be used)
- Threshold2 (ThresholdDown can be used)
Now you may set limits for most of test methods using script, e.g. you may set limit for free memory or free disk space, loss ratio or jitter limits for Ping tests, set limits for CPU load, UPS load or battery temperature and so on.
Some examples:
SetTestParam "main router" Threshold "50 %"
SetTestParam "main router" Threshold2 "50 ms"
SetTestParam _AllMemory Threshold "20 %"
SetTestParam _AllTraffic Threshold "55 KB/sec"
SetTestParam _AllTraffic Threshold "33 pkt/min"
SetTestParam _AllTraffic Threshold "22 pkt"
ReplaceTestParam _AllUPSTemp ThresholdUp 65 55
ReplaceTestParam _AllUPSTemp ThresholdDown 15 10
ReplaceTestParam _AllFreeSpace Threshold "20 %" "17 %"
ReplaceTestParam _AllFreeSpace Threshold "5 GB" "8 GB"
ReplaceTestParam _AllFreeSpace Threshold "6 GB" "15 %"
SetTestParamByID 11054 Threshold "10 MB"
- Process test in SNMP mode checked up to 1024 processes, now it checks up to 4096 processes
- Minor GUI improvements (HostMonitor and RCC)
The following issue was resolved
- In some rare cases "report generator" module could make HostMonitor unresponsive for several minutes (sometimes this may happen if you set SLA
reports with charts for a large set of tests; also HostMonitor could slow down when many test items launch Generate Reports action with disabled
"use reports pool" option and HostMonitor does not have access to the target folder). Fixed
|
|
|
Fixed several problems in Remote Control Console GUI
|
|
|
 New test methods New test methods
| IIS test | Internet Information Services (IIS) is an extensible web server running on Windows OS. HostMonitor can check various server parameters: requests/sec, cache hit ratio, error responses ratio and much more |
HostMonitor may check QNAP NAS storages using SNMP protocol |
| QNAP Health | This test method checks disks status, power status, volumes, pools, fans status |
| QNAP Temperature | Checks system, processor and disks temperature sensors |
| QNAP Fans | Checks system fans, sets Bad test status and triggers alerts when fan speed is out of specified range |
| QNAP Free Space | This test may check several drives on target system and find drive with minimum free space or drive with minimal percentage of free space |
| QNAP CPU Usage | Checks the percentage of CPU utilization |
| QNAP Memory | This test checks memory usage on QNAP devices |
HostMonitor may check Synology NAS storages using SNMP protocol |
| Synology Health | This test method checks disks status, RAID status, power supply status, fans status |
| Synology Temperature | Checks system and disks temperature sensors |
| Synology Disk Load | Check Synology storage disks load, finds busiest disk, sets Bad test status and triggers actions when load is over specified limit |
| Synology Free Space | This test may check several drives on target system and find drive with minimum free space or drive with minimal percentage of free space. |
| Synology CPU Usage | Checks the percentage of CPU utilization |
| Synology Memory | Memory test can check amount of free physical and virtual memory |
Improvements
- NetApp Free Space test: "check listed drives" option will count 0 size shapshots only if you set .snapshot keyword in "listed drives" field.
E.g. if you set "listed drives" using pattern /vol* then test will count snapshots but will skip 0 size snapshots
- %DiskSize% variable shows capacity of the disk. Variable can be used as parameter of actions triggered by Drive Free Space, QNAP Free Space, NetApp Free Space tests, etc.
- DiskMeter application can retrieve data from QNAP and Synology NAS storages
- Minor Web Service improvements
|
|
|
Improvements
- Service test
Service test may work in 3 modes:
a) Alert when service not started - HostMonitor checks specific service state
b) Alert when service not started or does not respond - HostMonitor checks service state and responsiveness (this mode used by default)
c) Alert when some "Auto" services not running
HostMonitor will get list of ALL services with Automatic startup type and check state of each service. If some "auto" service is not running,
HostMonitor will set Bad test status. You may specify comma separated list of services that should not be checked, e.g.
MMCSS,sppsvc,UxSms; you may use * wildcard at the end of the name, e.g. clr*,spp*
- ODBC Query test
Some ODBC drivers (e.g. MS SQL ODBC Driver version 13.1+) support Integrated Windows authentication and Active Directory Integrated
authentication. In this case you may type WindowsAuth instead of login name (for Integrated Windows authentication) or set
ADAuth as login name (for Active Directory Integrated authentication). Password field is not used in such case.
- SQL Query action
When ODBC driver supports such options, you may type WindowsAuth instead of login name (for Integrated Windows authentication)
or set ADAuth as login name (for Active Directory Integrated authentication). Password field is not used in such case.
- Database logging
When ODBC driver supports such options, you may type WindowsAuth instead of login name (for Integrated Windows authentication)
or set ADAuth as login name (for Active Directory Integrated authentication). Password field is not used in such case.
- Minor GUI improvements
- Improved WatchDog application
The following issue was resolved
- RMA for Windows: HP iLO Fans test could check specific fan but could not check all fans installed on the system. Fixed
|
|
|
New test methods
- Apache test (Apache HTTP Server is a free and open source web server for UNIX and Windows platforms).
HostMonitor can check the following Apache server performance metrics:
- Connections/sec
- Bytes/sec
- Busy workers
- Idle workers
- NGINX test (NGINX is high performance HTTP and reverse proxy server).
HostMonitor can check the following performance metrics:
- Connections/sec
- Requests/sec
- Non handled ratio
- Non handled count
- Current connections
- Busy(active) connections
- Waiting(idle) connections
- 1xx responses ratio
- 3xx responses ratio
- 4xx responses ratio
- 5xx responses ratio
- Total error responses ratio
- Cache hit ratio
- SSL fails ratio
- SSL handshakes / sec
- Health checks
- Tomcat test (Tomcat is one of the most commonly used servers for Java applications).
HostMonitor can check the following performance metrics:
- Free memory ratio (%)
- Used memory (MB)
- Busy threads
- Busy threads ratio (%)
- Requests/sec
- Bytes/sec
- Processing time
- Errors/sec
- Errors/requests ratio
Improvements
- HostMonitor (RCC): new popup menu "Switch to folder N" switches from Views pane to Folders pane and selects folder where current test item is located
- HostMonitor (RCC): new option for custom menu items. If command starts with [copy] keyword then HostMonitor
does not execute command, instead it resolves variables and copies data into clipboard.
E.g. if you set menu item using the following command line [Copy] Test: %TestName% Reply: %Reply% select the test
and click on menu, then HostMonitor will copy into clipboard buffer string with test name and reply value.
- New telnet command 'TDID <TestID>' (or 'TestDependentsByID <TestID>') shows list of IDs of all test items that depend on Master test specified by TestID
The following issue was resolved
- HostMonitor (RCC): if you copy multi-line text from clipboard into User Defined Variables list (Global variables), GUI did not process such operation correctly. Fixed
|
|
|
RMA for UNIX 1.32
- File Integrity test supports MD5, SHA256 and SHA512 digest. Use one of these modes when you need to check for
unauthorized file modifications. CRC32 can be used for legitimate modifications monitoring (not related to system security).
New test methods (HostMonitor, RMA for Windows)
- UPS Health
- UPS Load
- UPS Charge
- UPS Voltage In
- UPS Voltage Out
- UPS Temperature
- UPS Remaining Time
Using SNMP protocol HostMonitor may monitor uninterruptible power supply devices, check battery status, retrieve active alarm
conditions, monitor battery temperature and charge level, input voltage and so on.
HostMonitor can check various UPS models from APC, CyberPower, Hewlett-Packard Company, Eaton, IBM, TrippLite and more.
Network Discovery
- Replication option "Adjust test settings automatically" tells HostMonitor to adjust some settings according to target host OS and detected protocols.
Now it may set UPS type when you copy UPS related test
- New Replication option "If Master tests not copied, try to find new masters using existing tests as examples"
can be very useful when you already have set of test items related to the target hosts but you want to replicate some new test methods.
If you copy just dependent items, this option tells HostMonitor to check existing test items located in the target folder, find tests with similar
"master-pattern" and set the same masters for new test items.
Actions:
The following group names can be used in HM scripts
_AllUPSHealth _AllUPSLoad _AllUPSCharge _AllUPSVoltageIn _AllUPSVoltageOut _AllUPSTemp _AllUPSTime
E.g.
DisableTest _AllUPSLoad
EnableTest _AllUPSTemp
PauseTest _AllUPSHealth 10
Acknowledgments:
Normally HostMonitor resets operators comments when test status changes from "bad" to "good". Now you may change this behavior.
If you insert KeepAckCommentNDays=3 line into [Logging] section of hostmon.ini file and restart HostMonitor, it will keep comments
that are up to 3 days old (you may use different number, e.g. keep comments for 5 or 15 days)
|
|
|
HostMonitor, RCC and RMA: minor improvements and corrections related to the following modules
Tests
- HP iLO Health
- HP iLO Disks
- HTTP test
- URL test
Actions
- Send message to pager (TAP)
- Send message to beeper
- Send E-Mail
GUI
- Test Properties dialog for Drive Free Space test
- User profiles dialog
- Auditing Tool
MIB Browser improvements
- supports SNMPv3, authorization, encryption
- supports SNMP profiles
- more responsive GUI
Disk Meter improvements
- supports SNMPv3, authorization, encryption
- supports SNMP profiles
The following issue was resolved
- HostMonitor 11.10 Beta: WMI test could fail by timeout. Fixed
|
|
|
Improved tests
NT Event Log
New option "Report about last event but count ALL" works similar to "Report about last Bad/Good event" option, however it counts all NEW events that fit "bad" filter (and "good" filter if specified).
If "Show events description in Reply field for NT Event Log test" option is disabled (Options dialog) then test will display number of detected "bad" events in Reply field of the test.
Also you may use '%NTEvents_BadCnt%' and '%NTEvents_GoodCnt%' variables for Optional status processing, actions or Custom HTML reports (regardless of "Show events description" option). E.g.
- you may set Set Normal status if %NTEvents_BadCnt%<5 test option. This way HostMonitor will set Normal test status when there are NEW "bad" records in Event Log but number of such records below 5.
- or you may set Tune up Reply value, Reply = [%NTEvents_BadCnt%] test option, this way HostMonitor will display number of new "bad" events in Reply field of the test even if "Show events description" option" is enabled
File Integrity
- Now test may check MD5, SHA256 and SHA512 digest. Use one of these modes when you need to check for unauthorized file modifications. CRC32 can be used for legitimate modifications monitoring (not related to system security).
- Also HostMonitor/RCC GUI and "Import from file" function allows you to setup test item with empty digest. In this case HostMonitor will calculate and set digest on 1st test probe. This saves your time when you need to setup tests for large files.
- Minor GUI improvements
URL
- Now test may check MD5, SHA256 and SHA512 digest. Use one of these modes when you need to check for unauthorized file modifications. CRC32 can be used for legitimate modifications monitoring.
- New option "Compute and check digest within the following tags" allows to specify some important parts of the document and check digest only for these parts. E.g. check digest for HTML code between "<table" and "</table>" sections
Improved actions
Minor improvements related to the following actions:
- Show popup window
- Send e-mail
Improved Network Discovery
Copy/Paste/Replicate functions offer new option "Adjust test settings automatically". It tells HostMonitor to adjust some settings
according to target host OS and detected protocols. E.g. if you copy CPU Usage test from Windows to Linux host, HostMonitor may
change OS property from "Windows (RPC)" to "UNIX (SNMP)"; also HostMonitor may change SNMP profile specified for the tests; change
OS property for Memory tests; adjust Drive Free Space tests for Windows, UNIX or NetApp devices and so on.
New application: Disk Meter
Disk Meter displays chart with information about all disk drives mounted on local or remote system. Each disk represented by a bar; red colored bar indicates disk with free space below specified limit.
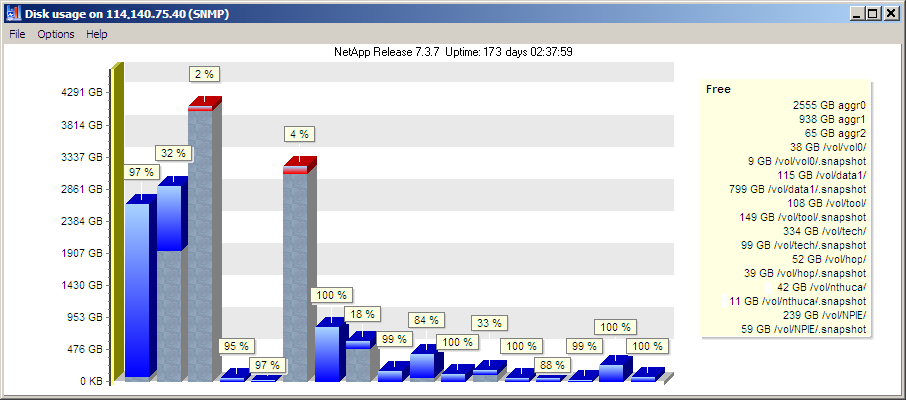
Disk Meter can connect to remote system using WMI or SNMP protocol and retrieve data from various systems, such as:
- Windows
- FreeBSD
- Linux
- AIX
- ESXi
- Solaris
- NetApp NAS
GUI improvements
- HostMonitor/RCC: new popup menu item related to Drive Free Space test allows to start Disk Meter using test settings for automatic data collection (note: SNMPv3 not supported by Disk Meter v1.00, will be supported in the next version)
- RMA Manager: better interaction between RMA Manager, HostMonitor and Active RMA agents
- Other minor improvements for HostMonitor, RCC and Web Service GUI
The following issue was resolved
- HostMonitor v11.00 Beta could not process connections from Active RMA agents when many agents sent requests at the same time. Fixed
|
|
|
Over 100 improvements were made in version 11.00, most significant listed below
- 24 new test methods
- 11 improved tests
- Improved actions
- New variables
- Improved built-in tools
- Improved external applications
- Speed optimization
New test methods
New test methods for UNIX systems allow you to check Linux, BSD, AIX and other UNIX-like systems without using RMA agent
(when SNMP protocol enabled on the system):
- Drive Free Space
- CPU Usage
- Process
(Memory test could check UNIX systems without RMA agent since version 9)
New test for monitoring Cisco devices
- Cisco Health
- Cisco Temp
- Cisco Fans
- Cisco Power
- Cisco CPU Usage
- Cisco Memory
New test methods allow you to check Juniper devices
- Juniper Health
- Juniper Temp
- Juniper Fans
- Juniper CPU Usage
- Juniper Memory
New test for monitoring NetApp storages
- NetApp Health
- NetApp CPU Usage
- NetApp Temperature
- NetApp RAID status
- NetApp Free Space
New test methods allow you to check HP servers using iLO protocol
- HP iLO Health
- HP iLO Temp
- HP iLO Fans
- HP iLO Power
- HP iLO Disks
Improved tests
| Dominant Process |
this test allows you to specify “exclude processes” parameter using expression like
firefox.exe[800 MB], oracle.exe[8 GB]
Expressions in square brackets tell HostMonitor to exclude firefox.exe and oracle.exe processes from check UNLESS firefox
uses over 800 MB or oracle uses over 8 GB (memory).
Similar expressions can be applied when the test checks for processes are using the most CPU, Handles or Threads;
e.g. svchost.exe[30 %] or chrome.exe[4000]
|
| Drive Free Space |
now test may check available space on remote Windows systems using SNMP protocol (or WMI as before) |
| Process test |
test may check Windows processes using SNMP protocol (or RPC as before) |
| CPU Usage |
test method can check Windows systems using SNMP protocol (or RPC as before). When SNMP mode used then last
minute CPU usage is displayed. Also test offers option to check either:
- average/cores CPU usage (for example if system has 2 CPU cores, 1st core shows 90% load, 2nd core shows 10% then HostMonitor will display average = 50%)
- max usage core (in this case HostMonitor will show 90% - core with maximum load)
|
| Certificate Expiration | works with certificates expiring after 2049 year |
| URL test |
- "Check contents" option may check multiline text, it replaces CR and LF with space character (CRLF replaced with 2 space chars)
- this test method was too slow checking some large HTML pages (e.g. 50MB page with specific HTML code) when
“download nested frames” or “download images” options enabled. New version works much faster
|
| HTTP test |
- "Check contents" option may check multiline text, it replaces CR and LF with space character (CRLF replaced with 2 space chars)
- this method was optimized as well and now works much faster checking big files.
|
| DNS test | can perform PTR requests (reverse DNS) |
| Traffic Monitor | works faster if target device supports SNMPv2c or SNMPv3 and appropriate version is specified for the test |
| Interface Status | works faster if target device supports SNMPv2c or SNMPv3 and appropriate version is specified for the test |
| SNMP Table | works faster if target device supports SNMPv2c or SNMPv3 and appropriate version is specified for the test |
Improved actions
Send E-mail action
- Consumes less system resources when HostMonitor needs to send hundreds of mails at once
Popup message action:
- New option "Max windows on screen" limits number of windows on screen (possible value 1..128)
- Increased limit for "time to live" parameter up to 1800 sec
HTTP request action
Several improvements related to HTTP mode (similar improvements for HTTPS mode were implemented earlier)
- About 30% less CPU load
- If POST request is used and 'Content-length:' header missed, HostMonitor inserts correct 'Content-length' line
- HostMonitor checks HTTP reply code and records error in the log when reply code<>200
New variables for NetApp RAID tests
| %DS_ActiveCount% | The number of disks which are currently active, including parity disks |
| %DS_ReconstructingCount% | The number of disks which are currently being reconstructed |
| %DS_ReconstrparityCount% | The number of parity disks which are currently being reconstructed |
| %DS_VerifyingparityCount% | The number of parity disks which are currently being verified |
| %DS_ScrubbingCount% | The number of parity disks which are currently being scrubbed |
| %DS_FailedCount% | The number of disks which are currently broken |
| %DS_SpareCount% | The number of available spare disks |
| %DS_AddingSpareCount% | The number of spare disks which are currently being added into a RAID group |
| %DS_PrefailedCount% | The number of prefailed disks marked for rapid raid recovery |
| %DS_OutdatedCount% | The number of outdated disks |
New variables for NetApp Health tests
| %DS_MaxUsedPercent% | The percentage of space currently in use or reserved by the fullest file system |
| %DS_MaxUsedINodesPercent% | The percentage of inodes currently in use by the fullest file system |
New variable for HP iLO tests (Health, Temp, Fans, Power, Disks)
| %HealthData% | If some problem detected, shows problem description (like "STORAGE STATUS: Degraded");
otherwise reports status of all checked components, e.g.
BIOS HARDWARE: OK
POWER SUPPLIES: OK
PROCESSOR: OK
FANS: OK
...
|
New group names supported by HM Script and Telnet interface
_AllHPHealth
_AllHPTemp
_AllHPFans
_AllHPPower
_AllHPDisks |
_AllNetAppHealth
_AllNetAppTemp
_AllNetAppDisks |
_AllJuniperHealth
_AllJuniperTemp
_AllJuniperFans |
_AllCiscoHealth
_AllCiscoTemp
_AllCiscoFans
_AllCiscoPower |
Improved built-in tools:
- Improved System Info
- Improved Network Discovery
- Improved Auditing Tool
- Stronger password checks
System Info improvements
- It works much faster when SNMP v2c or SNMP v3 is supported
- If possible, System Info tool selects SNMP profile with higher version of SNMP protocol
- If v1 protocol specified for all related tests, System Info still verifies if target device supports SNMP v2 and provides such information
- HostMonitor v10: some requests could not work with SNMPv3. Fixed
Network Discovery
- Recognizes more devices, e.g. Juniper and NetApp, various UPS devices
- Allows to create and replicate new test methods
- %Type% variable allows to search for Juniper, NetApp, SonicWall and UPS devices
- If you choose "all SNMP profiles" mode for some network, then HostMonitor sets priority for profiles with SNMP v2c and v3 versions (not applicable for devices already discovered by older version of the software)
Auditing Tool
- Checks operator accounts, for each operator with remote access checks password strength
- Checks strength of the passwords used by RMA agents
- Checks SNMP protocol version used for tests like Network Traffic, Interface Status, SNMP Table, tests related to Cisco, Juniper and NetApp devices; warns admin when SNMP v1 is used
Stronger password checks
- HostMonitor and RCC: User Profiles unit checks operator accounts, for each operators with remote access checks password strength
- RCC operator can change its own password using menu User->Change password. Software checks passwords strength and does not allow weak passwords (unless StrongRccPswd option disabled, see notes below)
- RMA Manager: as you know it allows to change passwords for existing agents using "Agent configuration" option. New RMA Manager uses new code for stronger password validation and does not allow weak passwords (unless StrongPswd option disabled, see notes below)
- RMA_Cfg utility (helps to setup RMA settings locally) uses new code for password validation as well. It warns the operator but allows weak passwords after confirmation
Note: software checks passwords using several algorithms, you cannot change algorithms however you may adjust some parameters using
[PswdCheck] section of hostmon.ini file. This section may look like
[PswdCheck]
MinLen=8
NormLen=12
LongLen=16
StrongRccPswd=1
|
MinLen=8 |
sets minimum password length 8, you cannot set this parameter below 6 |
| NormLen=12 | strings below 12 characters length (8..12) may be considered as strong password when digits, letters, capital
letters and/or special characters used; strings with 12 or more chars may pass the checks with less strict requirements (e.g. just
digits and Latin letters) |
| LongLen=16 | passwords with 16 or more characters may be considered strong even if simple charset is used (e.g. just
decimal digits). However additional checks still applies and 18-digits string like "123456789123456789" will not be considered
as strong password |
| StrongRccPswd=1 | tells software do not accept weak passwords when RCC operator changes its own password (1-default value).
If you set StrongRccPswd=0 then RCC will check password and warn the operator however any password will be accepted after confirmation |
Also, there is optional parameter in rma_mgr.ini file (used by RMA Manager)
[PswdCheck]
StrongPswd=1
Default value 1 - means RMA Manager will not accept weak passwords when operator will try to change password for existing/running agent using
"Agent configuration" option. If you set StrongPswd=0 then RMA Manager will check passwords and show warning when weak password detected
however any password will be accepted after confirmation.
Improved external applications:
- improved RMA for Windows
- improved MIB Browser
- minor changes and improvements were applied to Process Meter, Log Analyzer, Log Visualizer, RMA Manager, WatchDog, Web Service and Telnet Service
RMA for Windows
New Active and Passive RMA agents support 24 new tests for various systems:
- UNIX (Linux, BSD, AIX, etc)
- Cisco
- Juniper
- NetApp
- HP iLO
Improved tests:
- Dominant Process
- Disk Free Space
- Process test
- CPU Usage
- Certificate Expiration
- URL test
- DNS test
- SNMP Table test
- Network Traffic test
- Interface Status test
Faster processing for some service requests makes HostMonitor GUI faster (if SNMP v2c or SNMP v3 is used):
- Network interfaces window (it helps you to setup Network Traffic and Interface Status tests)
- System Info tool
Improved network discovery
MIB Browser
The following operations can retrieve data much faster when large set of counters requested and SNMP v2c is used:
- Get table
- Get row
- Get next N counters
Also it needs less time to load and save database
The following issues were resolved
- HostMonitor and Active RMA: SNMP Trap test could filter out some valid coldStart, warmStart messages. Fixed
- HostMonitor: in some cases HTTP test did not calculate CRC for images even with "download images" option enabled. Fixed
- RCC: import from local file could report errors regarding profiles used by SNMP related tests. Fixed
- Web Service: did not show total_good_tests / total_bad_tests statistics when logged in web operator does not have access to Root folder. Fixed
|
| |
Archive:
versions 10.00 - 10.70
versions 9.00 - 9.90
versions 8.00 - 8.86

Copyright (c) 2000-2020 by Advanced Network Software. All Rights Reserved
| |