|
 HM Web Service is an auxiliary application for HostMonitor. It is included into Advanced Host Monitor package.
Enterprise license for Advanced Host Monitor already includes a license for HM Web Service.
Holders of a Starter or Professional licenses may buy an additional license for Web Service separately.
HM Web Service is an auxiliary application for HostMonitor. It is included into Advanced Host Monitor package.
Enterprise license for Advanced Host Monitor already includes a license for HM Web Service.
Holders of a Starter or Professional licenses may buy an additional license for Web Service separately.
 Intro
Quick start
Settings
Advanced
Web Interface
System Requirements
Price Intro
Quick start
Settings
Advanced
Web Interface
System Requirements
Price
 This application works like an HTTP server and provides web interface for HostMonitor.
It means you can install Web Service on a local or remote system and check (and control) HostMonitor in real time using a web browser on any computer that is connected to the Internet.
This application works like an HTTP server and provides web interface for HostMonitor.
It means you can install Web Service on a local or remote system and check (and control) HostMonitor in real time using a web browser on any computer that is connected to the Internet.
Web Service allows you to check brief or detailed status of any test and folder. Also you may disable or enable tests, reset statistics and force tests to execution.
You will be able to start and stop monitoring, enable and disable alerting, etc.
Features:
- All data transmission between HostMonitor and Web Service is encrypted and password protected;
- HostMonitor & Web Service allow you to setup different user accounts with different sets of permissions;
- Controlling the HostMonitor is not the only function of HM Web Service.
It can be used as a simple web server providing access to files on a system where the Web Service is running. You may view HTML reports, logs and settings from anywhere.
- Web service can be started as regular application or as Win32 service.
 youtube demo 1 youtube demo 1
youtube demo 2
How to do (Quick start)
To allow remote management of HostMonitor via web browser follow these simple steps:
- start HostMonitor
-
configure HostMonitor's Remote Control Interface on RCI page in the Options dialog
Please note: when an internet browser acquires the document from the internet it may fetch several parts of the document at once to increase performance.
Thus "Maximum simultaneous connections" option of the HostMonitor's RCI interface should be set to 4 (minimum) even if just one user at a time will be connected to HostMonitor.
Otherwise the web browser may not be able to display a web page correctly.
- setup user accounts: use HostMonitor's menu "User"->"Operators"
-
start the Web Service. You can start it on the same system where HostMonitor is running or on any system that has TCP/IP connection with HostMonitor's system.
E.g. HostMonitor can be installed on the server inside of a corporate network but Web Service can be running on your home computer.
- configure Web Service: provide an address of the HostMonitor's system and TCP port that you had specified for RCI
- optionally set authentication methods and install certificates for secure connection
That's it. Now you can open web browser and enter an address of the system where Web Service is running (e.g. 209.173.80.15 or www.mycompany.com).
If you are running regular web server and our Web Service is installed on the same system, change the TCP port of Web Service from 80 to any other (e.g. 81).
In this case you will need to specify the port number in the URL that you are typing in browser's window, e.g. http://www.mycompany.com:81
Settings
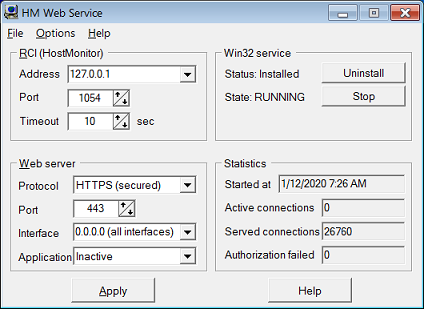
It is very easy to configure Web Service:
RCI (Remote Control Interface) settings
- Address: here you should provide an address of the system where HostMonitor is installed (keep the default '127.0.0.1' if HostMonitor and Web Service are installed on the same system)
- Port: please provide TCP port that is used by HostMonitor's Remote Control Interface (1054 by default)
- Timeout: the maximum amount of time (in seconds) that Web Service will keep waiting for the reply from HostMonitor before returning an error response to the browser.
Web server settings
- Protocol: You may choose protocol that should be used for communication between Web Service and web browser: HTTP or HTTPS.
If you choose secured HTTPS protocol, you should install SSL certificates. For more information please check SSL section of the manual.
- Port: TCP port on which Web Service will listen for incoming connections from the web browser (default TCP port for HTTP protocol is 80.
You may need to change it in case you already have a regular web server running on the same system).
- Interface: allows you to select specific network interface on which Web Service will listen for incoming connections from the clients (web browser).
Default value for this parameter "0.0.0.0" - all network interfaces installed on the system.
- Application status: set "Active" to activate Web service (it will then start listening for incoming connections and will respond to HTTP requests from any web browser).
If you start the software as a Win32 service then web server will be activated regardless of this option at the system startup.
Win32 service mode:
This group of controls allows you to check the status of the Windows service, install/uninstall, start or stop the service:
- Install / Uninstall: this button allows you to install/uninstall software as a Win32 service
- Start / Stop: this button allows you to start/stop the service
User profiles
User Profiles manager allows you to choose specific user profile as a default profile.
Settings from this profile will be used (copied) for each new account.
Note: Web Service creates new account on 1st successful login of the user; later profiles for each account can be modified independently.
"User Profiles" dialog is available through menu Options -> User profiles.
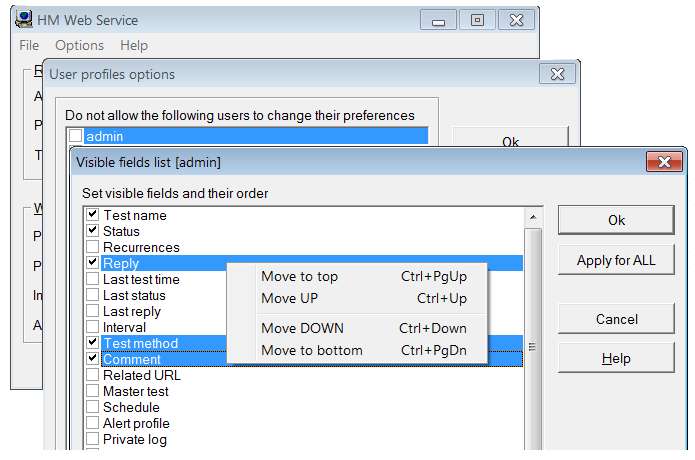
Also User Profiles manager allows you to set "Do not allow the following users to change their preferences" option for set of user accounts.
This option can be useful for "guest" accounts when the same account may be used for several/many persons.
If you set this option for the account, operator will not be able to change web interface preferences, such as:
- color palette
- folders tree mode
- folder pane width
- list of visible test properties
- sorting mode
- etc
You may open "Visible fields list" window using menu Options->User Profiles->Set fields.
Then reorder list of fields - select one or several items (using Shift and Ctrl) and move selected items using Ctrl+UP/Down, Ctrl+PgUp/PgDn keys.
Advanced options
Use menu Options -> Advanced to access dialog with some optional (non obligatory) settings.
- Regular interface: force browser to refresh content every NN sec
- Compact interface: force browser to refresh content every NN sec
Normally the content of a web browser window is refreshed only after the user had pressed the refresh button or after he had performed some operations (e.g. disabled or enabled a test).
With these options enabled Web Service will force browser to refresh the content every NN seconds.
- Use custom HTML pages to report errors
This option allows you to use custom configurable HTML pages to report errors.
With this option enabled in case of some problems Web Service will search 'misc' subdirectory for the following files:
| - errorpage1.htm | this page is used when Web Service cannot retrieve information from HostMonitor. E.g. RCI Interface is disabled or HostMonitor was not started at all. |
| - errorpage2.htm | this page is used when wrong (invalid) information is requested. For example this error may occur when another user have removed the test that you just want to check (retrieving detailed information about non existent test). |
| - errorpage3.htm | this page is used to report the error which indicates usage of incompatible HostMonitor and WebService versions. |
Please note: you may (and probably you should) use %WSResponse% variable in your custom HTML error pages. This variable represents actual error message (the response from Web Service).
Examples of error pages are found in 'misc' subdirectory. Feel free to change them according to your liking.
If an error page file does not exist, Web Service will use standard predefined error pages.
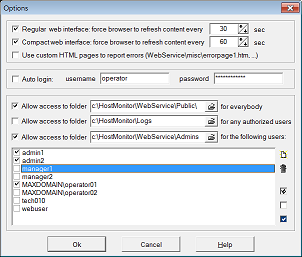
- Auto login
This option allows you to specify username and password that will be used when browser connects to Web Service.
This way user (who had started web browser to connect to HostMonitor) will not be prompted for a name/password at all (unless you provide invalid name or password).
We highly recommend to refrain from specifying accounts that have rights to change HostMonitor's settings (e.g. stop monitoring or disable test items).
Controlling the HostMonitor is not the only function of HM Web Service. It can be used as a simple web server providing an access to the files on a system where the Web Service is running.
You may view HTML reports, logs and settings from anywhere.
Use the following settings for enabling multilevel access to files and folders of a system where Web Service is running:
- Allow access to folder <path to folder> for everybody
You may enable an access to a specified folder (and all subfolders) for anybody who uses web browser and is connected to Internet/Intranet.
Anybody on the Internet/Intranet will be able to access this folder without authorization.
Regardless of the real name of the shared folder on your computer it will be visible under the name "public".
For example if Web Service is running on the machine hostmonitor.mycompany.com then to access the shared folder you should use this URL: "http://hostmonitor.mycompany.com/public/"
(if the name of the of the target file or folder is not specified then the closing "/" should always be present in url string).
- Allow access to folder <path to folder> for any authorized user
You may enable an access to a specified folder (and all subfolders) for authorized users only.
The user account with remote access permissions should be present in HostMonitor.
When the user will try to access this folder via internet he will be asked to provide his user name and a password.
Regardless of the real name of the shared folder in the computer it will be visible under the name "authorized".
For example if Web Service is running on the machine hostmonitor.mycompany.com then to access the shared folder you should use this URL: "http://hostmonitor.mycompany.com/authorized/"
(if the name of the target file or folder is not specified then the closing "/" should always be present in url string).
- Allow access to folder <path to folder> for the following users
You may enable an access to a specified folder (and all subfolders) for specified user(s) only, (e.g. you may allow an access only for "Admin" and "Manager").
The user account with remote access permissions should be present in HostMonitor.
When the user will try to access this folder via internet he will be asked to provide his user name and a password.
Regardless of the real name of the shared folder in the computer it will be visible under the name "private".
For example if Web Service is running on the machine hostmonitor.mycompany.com then to access the shared folder you should use this URL: "http://hostmonitor.mycompany.com/private/"
(if the name of the of the target file or folder is not specified then the closing "/" should always be present in url string).
If you will allow an access to public or authorized folders where HostMonitor stores private logs (for some tests) then the links to these private logs will be visible and users will be able to check the logs.
Note that the "private log" field must be included in the list of displayed fields.
Colors
 Each user may select a color palette for web interface according to his/her liking.
Only users who have access to the system where Web Service is running may control (create, delete and modify) color profiles.
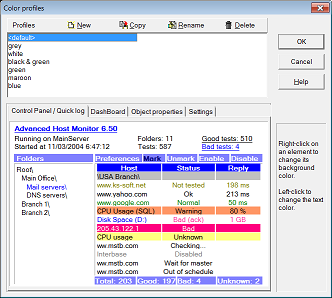
Use menu Options->Color to bring up Color Profiles dialog window.
Each user may select a color palette for web interface according to his/her liking.
Only users who have access to the system where Web Service is running may control (create, delete and modify) color profiles.
Use menu Options->Color to bring up Color Profiles dialog window.
You can fully customize color schemes for the Control Panel, DashBoard, Quich Log and other panels.
To manipulate with color schemes use 4 buttons:
| New | Create new palette. |
| Copy | Copy selected palette. This is useful if you want to make small modifications for the existing color palette. |
| Rename | Change palette's name. |
| Delete | Remove selected palette; you can remove all but one (the one named <Default>) color schemes. |
To modify colors of the selected palette, click on the element which you want to change color for.
Use right-click on an element to change its background color, and left-click to change the text color.
Web Interface
When you start a new instance of the browser and request information from the HostMonitor using URL like http://webservicehostname/, the browser first will ask for your name and password.
You will get the rights and permissions that are specified in your user account.
E.g. admin can perform any operations, guests can only view test statuses, etc.
Recommended web browsers: Google Chrome 32+, Opera 12+, FireFox 24+, Internet Explorer 11+ (some other browsers can be used as well, e.g. Safari for iOS)
Simplified web interface
If you have to use old web browser (not HTML5 compatible), you may switch to simplified interface (WS1) using URL like http://webservicehostname/ws1/index.htm
This way you may use Internet Explorer 5.50+, Opera 8.0+, Firefox 2.0+.
Compact Web Interface
Also, there is version of the interface designed for mobile devices with small screens.
To access this service use the following links:
http://webservicehostname/compact.htm
http://webservicehostname/tiny.htm
http://webservicehostname/links.htm
You may use compact interface on PC as well, it may look better if you add optional parameter "?mobile=0", e.g.
http://webservicehostname/compact.htm?mobile=0
http://webservicehostname/tiny.htm?mobile=0
Also you may use "?mobile=1" parameter if your mobile device misrecognized as PC, e.g.
http://webservicehostname/compact.htm?mobile=1
http://webservicehostname/links.htm?mobile=1
Toolbar
This pane shows brief statistics, also you may start and stop monitoring, disable and enable actions using sliding panel located near "Logout" button
- Start/Stop Monitoring
starts or stops monitoring. The caption of the button changes to reflect the current state of the HostMonitor on the remote (local) system
- Enable/Disable Alerts
enables or disables actions. The caption of the button changes to reflect the current state of the Alerts on HostMonitor.
Additional "warning" icons displayed when monitoring is stopped or actions disabled.
If you hide toolbar using "Toolbar off" button, warning icons can be moved to any convenient place (use mouse to drag icon).
Toolbar pane allows you to switch between 5 main workplaces: Management panel, DashBoard, Quick Log, Top Hosts and Network Map.
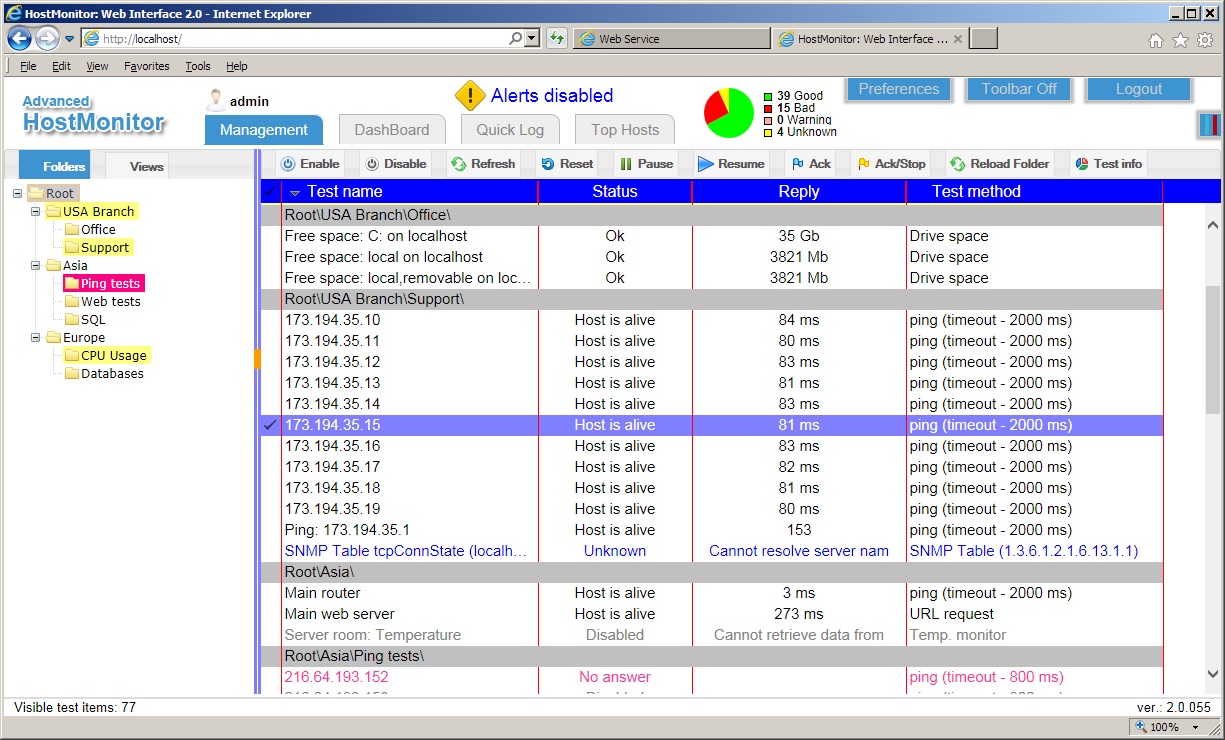
1) Management panel
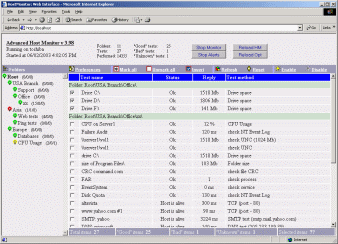 Management panel provides the interface which resembles HostMonitor's own GUI.
Left part of the pane is a Folder section that displays Folders and Views.
The right part - Test section, it shows test items from within the selected folder or view.
Management panel provides the interface which resembles HostMonitor's own GUI.
Left part of the pane is a Folder section that displays Folders and Views.
The right part - Test section, it shows test items from within the selected folder or view.
Folder section.
Here you see the list of all folders and subfolders available in HostMonitor. If you click on the folder name, you will see the list of test items from that folder in test section.
If you are using simplified version of the interface (WS1), Web Service does not change color of each folder item depending on number of bad/warning test items within the folder; instead it shows an indicator to the left of the folder name.
When an indicator is green it means all the tests in this folder have "good" status, yellow means that one or more tests have "unknown" status, red is an indication that at least one test has a "bad" status.
You may click on indicator to check folder properties or to see corresponding lists displaying good, bad or unknown test items.
There are also numbers to the right of the folder name - the number of "good" / "bad"+"warning" / "unknown" tests in the folder.
Test section
It displays the list of all tests from within the selected folder (or view).
You may set the Web Service to show you any available property of the test in this list, sort them, filter by the status and perform the following operations with selected set of test items:
- [Enable], enables selected test(s)
- [Disable], disables selected test(s)
- [Refresh], forces test probe for selected item(s) regardless of schedule
- [Reset], resets the statistics for the selected test(s)
- [Pause], allows you to pause monitoring for selected test item(s) for a specific interval, e.g. next 20 min
- [Resume], resumes paused test item(s)
- [Ack], use this link to acknowledge test(s) status.
- [Ack/Stop], acknowledge status and stop alerts.
- [Test info], opens Test Info window (applicable for single selected item)
Also you may use popup menu functions: click right mouse button on test item and choose operation - it allows you to Refresh, Pause or Disable test items, Acknowledge "bad" status, open Test Info window, etc.
You may use Ctrl+H and Ctrl+L hot keys to check performance history and quick log accordingly.
Note: If you are using simplified version of the interface (WS1), popup menu functions are not available; instead you may click on first field (usually it displays test name).
This link will take you to a new window with detailed information about the test.
You may select set of test items using Shift key or Ctrl key and left mouse click (this option is not available if you are using WS1 simplified interface); also you may select the test using checkbox in front of each test name - mark it to select the test or unmark it to deselect it.
Plus there are 3 commands (in order to access these commands click on checkbox image located in header line):
- [Select all] - selects all tests in the list;
- [Unselect all] - use this command to unmark (clear) all checkboxes at once;
- [Inverse selection] - inverts the selection
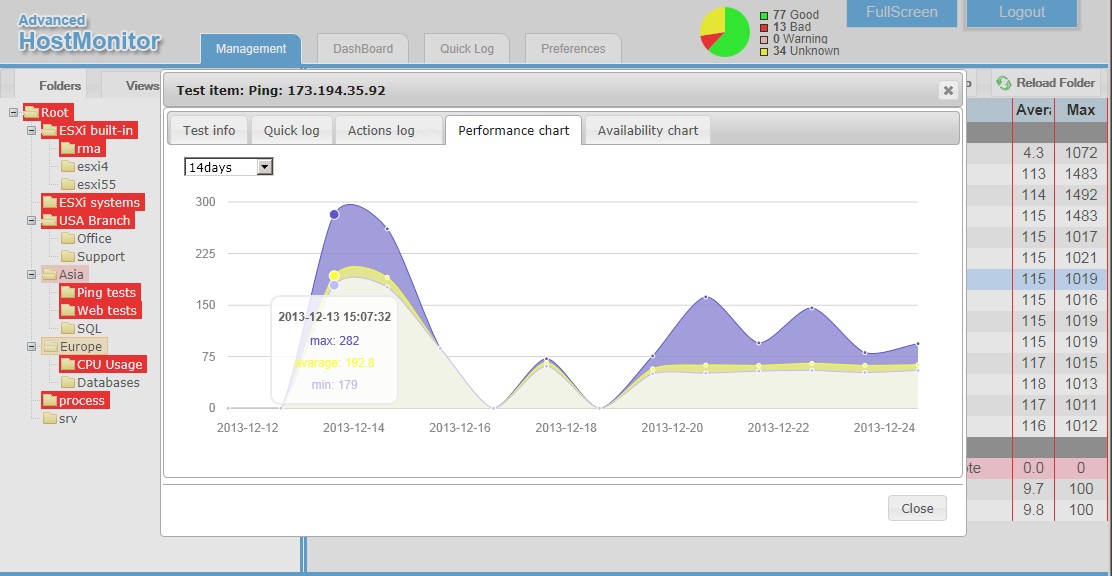
Test info
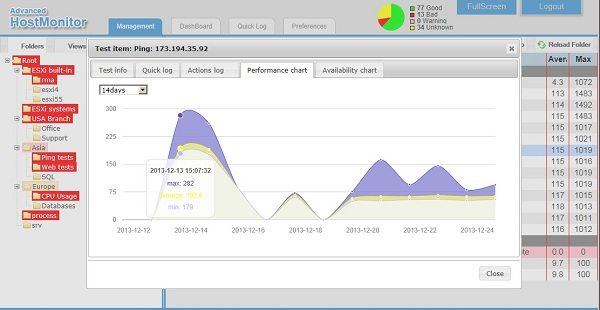 Test Info window can be used in any workplace, it offers the following pages:
Test info page provides information about selected test item, such as current and previous state, statistics, modification date, comments, related URL, etc.
Quick log page displays last 10 events for selected test item.
The term "event" means a log record that was added with every test status change. If logging mode for the test is set to "Reply" or "Full", HostMonitor will add a new record when test status changes or the value of "Reply" field changes.
Actions log page shows the following information:
- Event time (the time when action has been executed);
- Status of the test (when action was triggered);
- Action method (type of the action);
- Result of the action execution
Note: you may tell HostMonitor to ignore some actions, i.e. do not store information about action results in Quick Log. The option "Quick Log: store action results" is located in Action Properties dialog. You may disable the option for non-important actions, like "Play sound" action.
Performance chart shows graph using information about minimum, maximum and average reply values of the test item over selected time interval.
You may choose any of the following time periods to display:
- Today
- Yesterday
- Last 24 hours
- Last 48 hours
- This week
- Last week
- Last 7 days
- Last 14 days
|
- This month
- Last month
- Last 30 days
- Last 60 days
- This year
- Last year
- Last 12 months
- Last 24 months
|
Availability chart shows graph using information about alive/dead/unknown test results ratio over selected time interval.
SNMP Data page: when you select SNMP Table test item, you may check the table with data retrieved from SNMP agent.
For each retrieved counter, it shows OID, current value, previous value and difference.
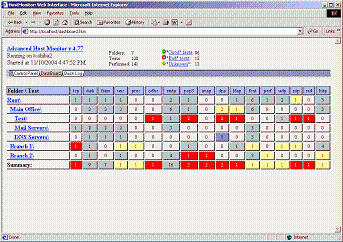
2) Dashboard
Dashboard is an indicator panel. One glance at the dashboard will give you comprehensive overview of all tests in all folders.
Every folder is represented by a row on the dashboard. Each cell of the row represents tests of a certain type from within that folder (e.g. Ping, CPU Load, Service, Drive Free Space).
Number inside cell and their color depend on the tests results:
|
|
| Color | Meaning of the color of the cell | Meaning of the number in the cell |
| N | Some test(s) have "bad" status (non-acknowledged) | Number of "bad" test items |
| N | No "bad" tests but some test(s) have "warning" status (non-acknowledged) | Number of "warning" test items |
| N | No "bad" or "warning" test items but some test(s) have "unknown" status (non-acknowledged) | Number of "unknown" tests |
| N | There are some "bad", "warning" or "unknown" items, all of them acknowledged | Number of acknowledged tests |
| N | No "bad"/"unknown" tests but there are "WaitForMaster" test item(s) | Number of tests with "Wait.." status |
| N | ALL tests are disabled | Number of disabled tests |
| N | All tests have "OutOfSchedule" status | Number of "OutOfSchedule" tests |
| N | No "bad"/"unknown"/"WaitForMaster" items, some (all) tests are "good" | Number of "good" test items |
| 0 | No tests of this type in the folder | 0 - no tests |
When you click on cell, popup window will show list of tests which have determined current status (color and value) of the cell.
For example if you click on "red" cell that represents Ping tests for "USA Office" folder, you will see all "bad" ping test items within this folder.
Then you may use popup menu items to check test statistics, quick log, actions log, charts, enable or disable test items, acknowledge test status, etc.
When you click on folder item, interface will switch to Management mode and open selected folder.
Note: If you are using simplified version of the interface (WS1), popup menu functions are not available;
instead you may click on folder name link to check folder properties or to see corresponding lists displaying good, bad and unknown test items as well as complete list of tests in the folder.
3) Quick Log
Quick Log workplace displays most recent events. The term "event" means a log record that was added with every test status change.
If logging mode for some test is set to "Reply" or "Full", HostMonitor adds a new record when either the test status or "Reply" field value of the test changes.
Quick Log pane offers popup menu: you may click right mouse button on test item and choose operation
- it allows you to Refresh, Pause or Disable test items, Acknowledge "bad" status, open Test Info window, check log records for the test item, actions log, availability and performance charts for various periods (7, 14 days, 30 or 60 days, week or 2 weeks, last or current month, etc.)
Quick Log mode can be used for audio alerts, interface will start alert when new "bad" event detected. There are 3 modes available:
- Sound off
- Sound once
- Sound continuously
Note 1: in order to switch mode use right mouse click on "Quick Log" tab
Note 2: when "Sound continuously" option is selected you may stop audio alert using "Stop alerts" button located in "Alert" window or "Stop alerts" popup menu item located in "Quick log" tab context menu
If you are using simplified version of the interface (WS1), audio alerts option is not available; also there is no popup menu.
Quick Log pane provides links to test properties. Click on the name of the test and the Web Service will display the Test Properties window.
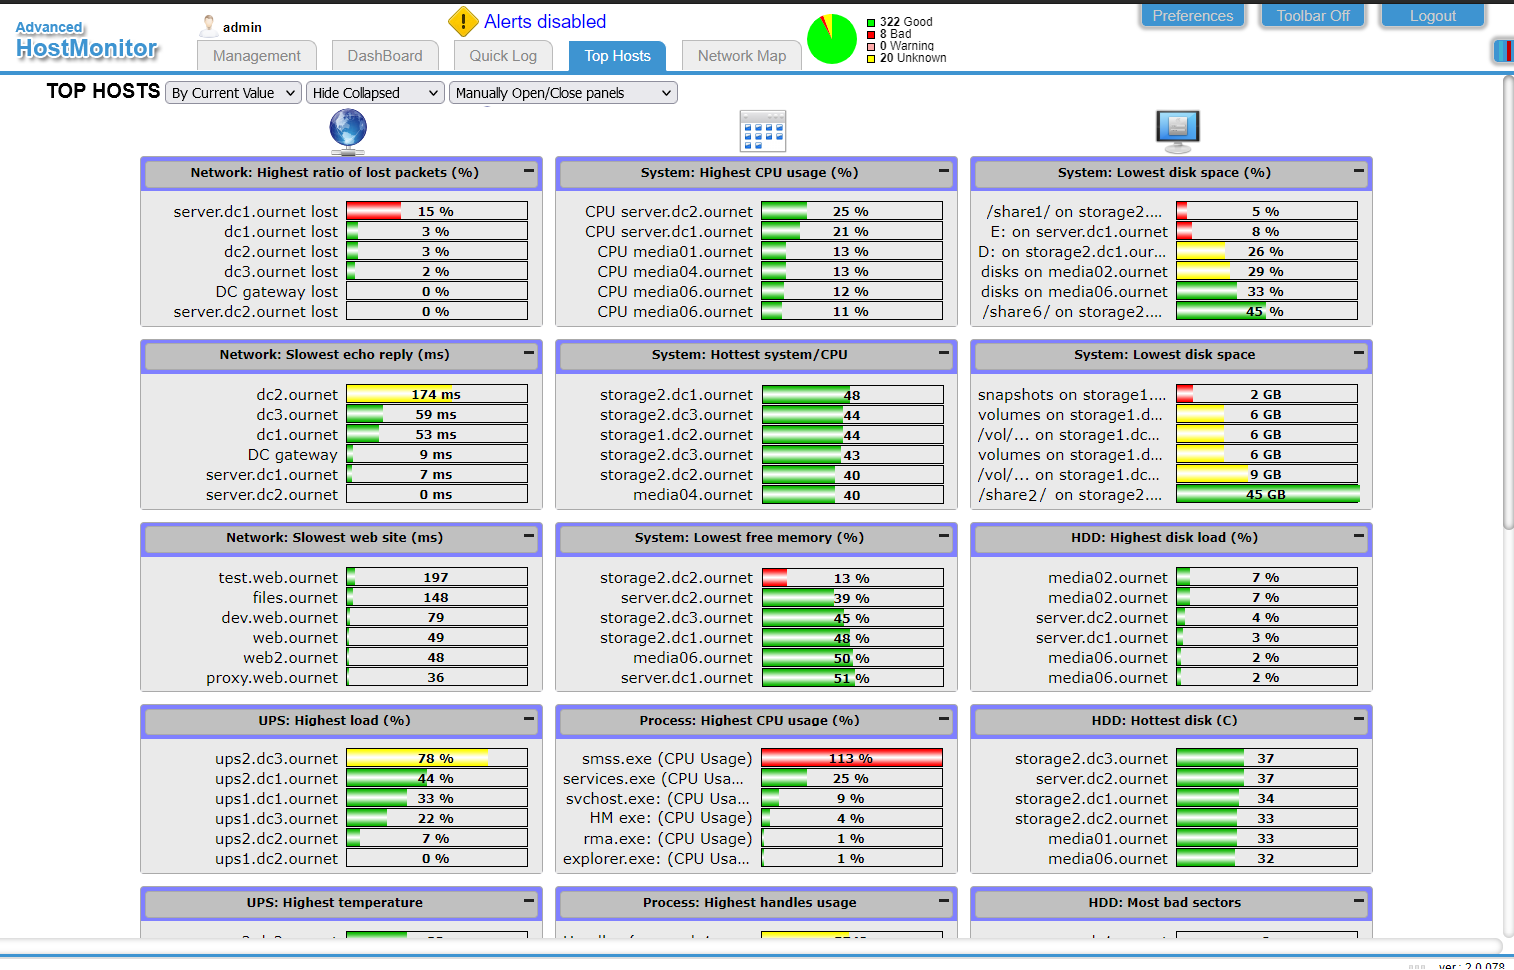
4) Top Hosts
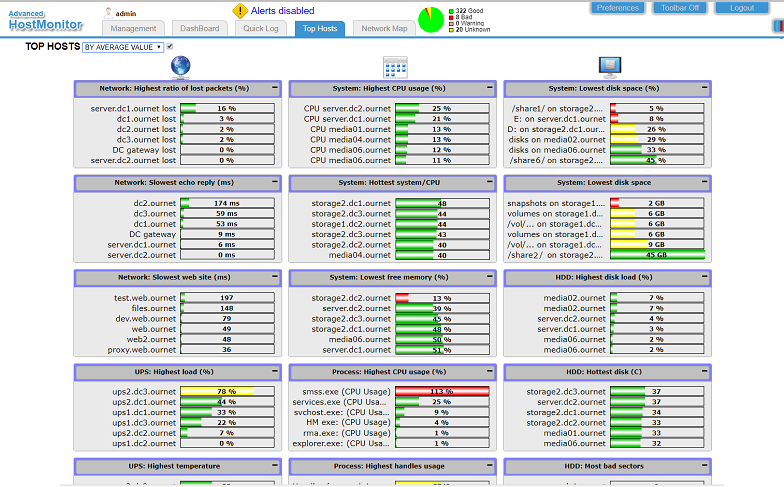
Top Hosts pane shows "top" test items from the following categories:
| Highest ratio of lost packets (%) | Ping tests |
| Slowest echo reply (ms) | Ping tests |
| Slowest web site (ms) | URL and HTTP tests |
| Highest CPU usage (%) | CPU Usage tests |
| Hottest system/CPU | QNAP, Synology, NetApp, Cisco, Juniper and HP iLO Temperature tests |
| Lowest free memory (%) | Memory tests |
| Lowest disk space (%) | Disk Free Space and UNC tests |
| Lowest disk space | Disk Free Space and UNC tests |
| HDD: Highest disk load | Synology Disk Load and Windows Performance Counter ('% Disk Time') tests |
| HDD: Hottest disk | includes QNAP Temperature, Synology Temperature and HDD Smart tests |
| HDD: Most bad sectors | SMART tests |
| HDD: Oldest disks | SMART tests |
| Highest CPU usage (%) | Dominant Process tests |
| Highest handles usage | Dominant Process tests |
| Highest threads number | Dominant Process tests |
| Highest memory usage | Dominant Process tests |
| Highest VM usage | Dominant Process tests |
| UPS: Highest load | UPS Load tests |
| UPS: Highest temperature | UPS Temperature tests |
| UPS: Lowest charge level | UPS Charge tests |
You may click right mouse button on displayed test item and choose operation. Popup menu allows you to Refresh, Pause or Disable test items, Acknowledge "bad" status, open Test Info window, check log records for the test item, check actions log, display availability charts and performance charts for various periods (7, 14 days, 30 or 60 days, week or 2 weeks, last or current month, etc.)
- Show Collapsed / Hide Collapsed
- Automatically open&close panels / Manually open&close panels
Using these options and drag&drop operations, you may organize panels to your liking. For example you may set Show Collapsed + Manually open&close panels options,
move Web related groups to the top, move UPS related groups to the bottom, minimize(close) HDD related groups, then switch from Show Collapsed to Hide Collapsed.
While "Automatically open&close panels" option tells Web Service to open groups with data (tests) and minimize or hide groups without available tests.
Note: Top Hosts pane not available in simplified version of the interface (WS1).
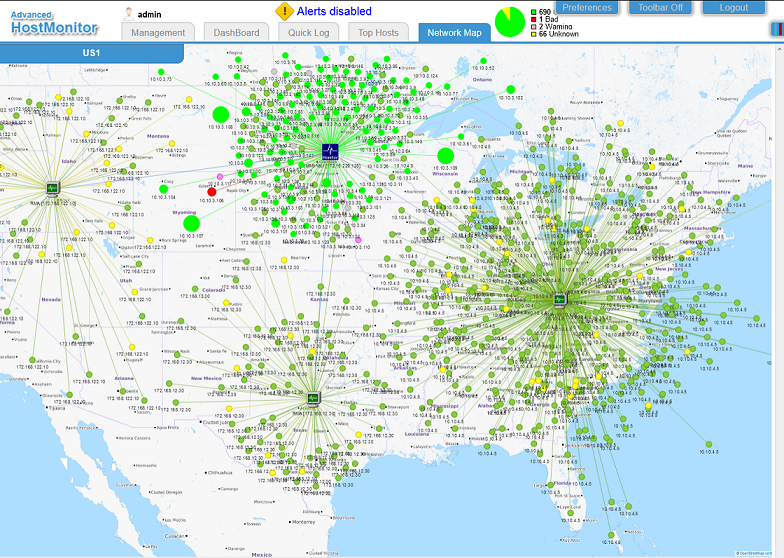
5) Network Map
Web Service may group all tests related to the same host, set links between different hosts depending on HostMonitor-RMA and Master-Dependants relations and display HostMonitor, RMA agents and all hosts on interactive map.
Gravity and Spiral. Web Service may set initial positions for the elements using "Gravity" and "Spiral" algorithms.
Spiral works much faster so we recommend this method when you are monitoring thousands of hosts.
Actually you may use both methods - init entire WAN map using Spiral algorithm, then select some part of the map (e.g. click on RMA agent to select agent and all hosts monitored by this agent) and apply Gravity algorithm for this LAN.
Note: Spiral algorithm will reset entire map, while Gravity algorithm may work with entire map or selected subset (e.g. RMA agent with hosts or Master test with dependent items).
When you click on Gravity button, button caption changes to "Stabilize/Stop" and you may click it again when map looks "good enough" without waiting for algorithm to complete.
Then you may manually adjust position of any element (standard drag&drop).
If you drag master item and hold the button depressed, interface will rearrange dependant items using Gravity algorithm; release mouse button to stop this process at any time.
Rotate left / Rotate right - these buttons may work with entire map or with selected segments (just like Gravity button).
Undo and Redo buttons help to fix mistakes.
Zoom - use mouse wheel to zoom in / zoom out.
Background images
You may set comment, load background image (select image from drop-down list and click "Set map background" button), then save map settings using Save or SaveAs buttons.
Some background samples located in WebService\mapsbg\ folder, images based on data provided by OpenStreetMap (https://www.openstreetmap.org/copyright).
You can create your own images to fit your company standards and copy files into this folder.
Items
Item color depends on status of all tests related to the host. E.g. green means all tests have "good" status (and may be some disabled tests);
yellow means there are some tests with "unknown" status; pink - warning tests; red - there are some "bad" tests;
orange - there are some "bad", "warning" or "unknown" items, all of them acknowledged; grey - all tests disabled.
Size of the item depends on number of tests related to the host.
Click on the host (right mouse button) and you will see test items related to the host: test name, last reply and average reply value.
Then you may select test and use popup menu (right mouse click again) to enable, pause, resume test, acknowledge test status, check quick log, check performance history and so on.
Preferences
This link brings up the options/settings window.
The settings and options that you define through this window are individual for each user and they are stored with Web Server so that when you will log in to HostMonitor next time (even from some another computer) your settings from the previous session will be saved for you.
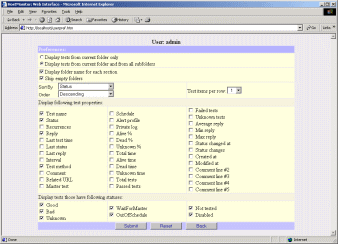 The following options are available:
- Palette
Here you may choose a color palette for Web Interface. Please note: only persons that have access to system where Web Service is running can modify predefined palettes or create new palettes.
- Display all (sub)folders at once
With this option selected Web Service will always display expanded view of all folders and descendant subfolders in the Folder section.
- Use interactive folder tree (cookies must be enabled)
With this option selected you will be able to expand or collapse any folder(s).
(these options make sense for simplified version of the interface WS1)
- Folder section width
This parameter allows you to set the default width (in pixels) for the Folder section.
(this option make sense for simplified version of the interface WS1)
-
Display tests from current folder only
When this option is enabled the right pane will show you only the tests from the current folder (the one that is selected through the left pane;
the name of this folder is shown in bold) not including the tests from the subfolders.
- Display tests from current folder and all subfolders
This option allows you to see all tests from the current folder and all of subfolders.
-
Display folder name for each section
This option lets you to see the name(s) of folder(s) in the right pane of the window.
The folder name appears at the beginning of the list of tests from within that folder.
You may found this option useful especially when the current folder has lots of subfolders.
- Skip empty folders
After enabling this feature folders that have no tests in them will disappear from the right pane.
- Do not wrap text at the right margin
If this option enabled, Web Service tells visual user agents (web browser) to disable automatic text wrapping. Otherwise browser may show test property (e.g. Reply field) in several lines.
- Sort by, here you may specify the field to sort the tests by.
- Sort order, you may set the ascending or descending sort direction.
- Test items per row
This option allows you to place more then one tests in each row of the tests list, so that tests will be arranged in columns.
(this option make sense for simplified version of the interface WS1)
- Display the following test properties
This is an array of checkboxes, by marking/unmarking them you may specify the list of fields (test properties) to display.
- Display only tests that have following statuses
Here you may filter the list of tests forcing the Web Service to show you only the tests with certain statuses.
Please note: if "Checking" switch is marked, Web Service will display "Checking.." for test items which HostMonitor is checking right now).
Otherwise you will see status that said test items had just before check was started.
Notes related to simplified interface (WS1): after you had changed any of the options do not forget to hit "Submit" button.
Only after this the changes will take effect. Hitting the "Back" button in the settings window as well as the browsers back button will discard all your changes.
The button "Reset" sets all settings to their default values.
Note, after you have changed the settings in web interface you may need to click browsers "refresh" button to see immediate results of the changes
(especially if you are using Internet Explorer, sometimes you need to use Refresh function several times).
Authentication modes
You may set allowed authentication mode using Web Service menu Options -> Authentication
HostMonitor authentication
Web browser will prompt for user name and password, operator should type user name and password set on HostMonitor side (menu User -> Operators).
Traffic between browser and Web Service is not secured (unless HTTPS is used). Traffic between Web Service and HostMonitor are secured (just like HostMonitor<->RCC or HostMonitor<->RMA traffic).
Windows or HostMonitor authentication (priority: Windows authentication)
If remote operator logged on to the domain, web browser will try to get access to Web Service using Windows authentication mechanism (Kerberos).
HostMonitor user account with the same name should be set with "HM or Windows authentication" option and both HostMonitor and WebService processes should be started on the same system (domain member).
Otherwise browser will prompt for user name and password and HostMonitor authentication will be used.
HostMonitor or Windows authentication (priority: HostMonitor authentication)
Web browser will prompt for user name and password.
However If remote operator logged on to the domain and HostMonitor user account with the same name set with "HM or Windows authentication" option and both HostMonitor and WebService processes are running on the same system (domain member) then you can type WindowsAuth instead of user name and web browser will be able to connect to HostMonitor using Windows authentication mechanism (Kerberos).
Note: if you start web browser, login then switch authentication mode and want to logout and login again using different authentication mode, you may need to restart browser (not just open new page).
Kerberos notes
When web browser and web service begin communications, they pass encrypted tickets through a trusted third-party system (Key Distribution Center).
The KDC passes a secret ticket with a decryption key to both nodes. The nodes then pass encrypted time stamps to each other and use the key to decrypt them.
If they do so successfully, they authenticate their counterparts and can trust each other.
The KDC is integrated with Windows Server security services that run on the domain controller (DC) and uses the Active Directory Domain Services database as its security account database.
However you should set remote user permissions on HostMonitor side (password in not used in this case, provide password if you plan to use Windows AND HostMonitor authentication modes).
Requiements
- approximate clock synchronization between the machines on the network (HostMonitor/WebService system, Domain Controller, remote operator system).
If the time difference between the server and client is greater than five minutes, authentication will fail
- DNS entries and hosts on the network are all properly configured
- HostMonitor and Web Service should be started on the same system (domain member)
- Web Service cannot use local system account in this case, it should be started under domain user (e.g. domain1\webuser)
- set Service Principal Names (SPN) directory property for an Active Directory service account used by Web Service. E.g.
Setspn /s HTTP/wshostname.domain1.com domain1\webuser
Setspn /s HTTP/wshostname domain1\webuser
You may need to use both commands, this helps to avoid some Internet Explorer problems (e.g authorization will work for 30 minutes).
More information available at docs.microsoft.com
Browser settings
FireFox:
- in the URL text box of the Firefox browser, enter about:config to access the advanced settings; click Accept the Risk and Continue;
- find and double-click on network.negotiate-auth.trusted-uris in the Preference Name column; enter web service URL in the text box
(If you are using multiple connectors for Kerberos authentication, add a comma separated list of connectors);
- HTTPS protocol should be set on Web Service and must be used for FireFox
Internet Explorer / Microsoft Edge:
- in the Internet Options window select the Security tab; click on the Trusted Sites icon and then click the Sites button; add Web Service URL to the Web sites list;
- in the Internet Options -> Security tab click the Custom Level button; make sure
- User Authentication -> Logon is set to Automatic logon with current username and password
- Miscellaneous -> Web sites in less privileged Web content zones can navigate into this zone is set to Enable.
- in the Internet Options window click the Advanced tab; ensure that Security->Enable Integrated Windows Authentication option is set
Chrome:
- Chrome uses the Internet Explorer configuration to enable Kerberos authentication so you should configure Internet Explorer
SSL
You may secure Web Service by using HTTPS protocol and SSL certificates.
An SSL (Secure Sockets Layer) certificate is a digital certificate that authenticates the identity of the web site, SSL technology allows to encrypt all data transfer between web server and the client (web browser).
Each SSL Certificate consists of a public key and a private key.
When a web browser connects to a secured web server, a Secure Sockets Layer handshake authenticates the server and the client (web browser).
An encryption method is established with a unique session key and secure transmission can begin.
If you want to setup Web Service to work over HTTPS protocol, you should have two files in PEM format: server certificate and private key.
Certificate and private key files must be named as ServerCert.pem and ServerKey.pem accordingly. These files should be located in the same folder where Web Service is installed.
If you have certificate and private key, stored in PEM files with other names, just rename the files
- ServerKey.pem - Private key used to encrypt data. It must correspond to the public key stored in the certificate (ServerCert.pem file)
- ServerCert.pem - Public key (certificate) to be sent to the remote site for authetification. This key can be protected by password. In such case Web Service will ask you for password on startup (just 1 time, unless you change the file).
Where can you get these files?
There are several possible ways:
- Use SSL certificate that already installed on your IIS web server
- Use SSL certificate that already installed on your Apache web server
- Create CSR (Certificate Signing Request) and request certificate from external certification authority like VeriSign, Thawte, etc.
- Create self-signed SSL certificate
Please check manual.PDF file for detailed information ("Web Service: SSL" section of the manual)
Please note: OpenSSL package has to be installed in order to perform all necessary steps.
Minimum system requirements
The system on which you plan to run the HM Web Service should meet the following requirements:
- Windows XP SP3, Windows 7, Windows 8.1, Windows 10 or Windows 11
- Windows Server 2003 SP2, Server 2008 SP2/R2, Server 2012, 2016, 2019 or Windows Server 2022
- TCP/IP connection (LAN or Dial-up)
- 12 MB of free disk space
How much does it cost?
When you purchase an Advanced Host Monitor ENTERPRISE edition you will get the license for Web Service at no cost.
Otherwise the license for Remote Control Console, Web Service and Telnet Service costs $199.
You can order Web Service using credit card, Switch and Solo debit cards, check/money order or wire transfer.
Details..
|


 Each user may select a color palette for web interface according to his/her liking.
Only users who have access to the system where Web Service is running may control (create, delete and modify) color profiles.
Use menu Options->Color to bring up Color Profiles dialog window.
Each user may select a color palette for web interface according to his/her liking.
Only users who have access to the system where Web Service is running may control (create, delete and modify) color profiles.
Use menu Options->Color to bring up Color Profiles dialog window. The following options are available: