|
 |
|
|
| | What's New |
| | |
|
|
|
|
|
|
|
|
|
|
 New test method New test method
HostMonitor and RMA for Windows: DHCP Pool test checks percentage of available IP addresses (IP addresses available
for the allocation by Windows DHCP server) and alerts when it falls below specified limit. DHCP servers are configured
with one or several ranges of IP addresses, HostMonitor may check specific range or check all DHCP scopes and find
subnet with lowest percentage of available IP addresses.
 Improvements Improvements
HostMonitor: SFTP and SSH test methods support more key exchange algorithms:
- diffie-hellman-group1-sha1
- diffie-hellman-group14-sha1
- diffie-hellman-group-exchange-sha1
- diffie-hellman-group-exchange-sha256
- curve25519-sha256
- ecdh-sha2-nistp256
- ecdh-sha2-nistp384
- ecdh-sha2-nistp521
|
|
|
Passive RMA 1.36 for Amazon Linux 2 (ARM64)
HostMonitor: new operators for optional status processing and "advanced" actions (useful when you need to parse multi-line text
where lines separated by CR, LF or CRLF characters)
| getlinewith | checks for specified text, returns 1st matched line with this text |
| getlinestarts | returns 1st line that starts with specified text |
| getlineends | returns 1st line that ends with specified text |
| gettagval | finds specified tag, returns tag value, e.g. expression
"<tagAA>value11</tagAA><tagBB>value22</tagBB>" gettagval "tagBB"
returns "value22" |
HostMonitor: new variables
| %Reply_DQuotes% | represents Reply field where single quotation marks replaced with double quotation marks |
| %Reply_SQuotes% | represents Reply field where double quotation marks replaced with single quotation marks |
| %SuggestedReply_DQuotes% | represents "suggested" Reply value where single quotation marks replaced with
double quotation marks
("Tune up reply" option allows you to change Reply value after test execution) |
| %SuggestedReply_SQuotes% | represents "suggested" Reply value where double quotation marks replaced with single quotation marks |
HostMonitor: minor URL test improvements related to HTTPS protocol
RMA for Windows (Active and Passive agents): SFTP and SSH test methods support more key exchange algorithms:
- diffie-hellman-group1-sha1
- diffie-hellman-group14-sha1
- diffie-hellman-group-exchange-sha1
- diffie-hellman-group-exchange-sha256
- curve25519-sha256
- ecdh-sha2-nistp256
- ecdh-sha2-nistp384
- ecdh-sha2-nistp521
Web Service: minor improvements
|
|
|
Improvements
Optimization: if you are using many RCC (Remote Control Console) clients connected to HostMonitor that performs
a lot of tests (e.g. 400 tests/sec and 20 RCC), then update Advanced Host Monitor to version 12.84, it works much
faster (still not perfect in your case? Please contact us, we may help to adjust some parameters)
Improved "basic" HTML reports
Improved SLA reports (HTML mode)
Improved Compact (HTML) reports
- you may set width and height of elements using standard CSS units (px, pt, in, em, ch, auto and more)
- now its easier to set list of fields displayed by popup window (this window displayed when you click on the element); also you may click on other elements without closing popup window first
- header shows name, status and reply value of the current element (element near mouse pointer)
- improvements for mobile devices with small screen
- and more..
sample compact report1
sample compact report2
Added %AlertProfileComment% variable for Send e-mail actions
Minor Web interface improvements
|
|
|
New test methods
Improved tests
- Text Log test: now you don't need to use TextLog_ForceCheck option for log files that are held open by some application
- URL test uses less memory and less CPU cycles when it checks hash of entire page (large page without
checking for images or frames, e.g. when HostMonitor verifies integrity of some file archive)
Optimization
- HostMonitor: about 15% faster SLA reports generation (SLA reports in HTML format without charts)
- LogAnalyzer: about 15% faster HTML logs processing
- LogVisualizer: about 30% faster HTML and TXT logs processing
- HostMonitor: if you are using old "Custom Table&Stats" report template, you may switch to faster version
note: you need to add or update report profile manually using the following template)
IPMI Browser improvements
- new menu File -> Reload SDR records
- new menu File -> Reload thresholds
- GUI improvements
 The following issues were resolved
- RMA for Windows: IPMI Health test could lead to Handle leak (only RMA v5.40 affected)
- HostMonitor and RCC: minor GUI corrections
|
|
|
New application: IPMI Browser
IPMI (Intelligent Platform Management Interface) is a set of computer interface specifications for out-of-band management of computer systems.
IPMI subsystem works independently of the host CPU, firmware and operating system. IPMI provides a way to manage a computer that may be powered off
or otherwise unresponsive by using a network connection to the hardware rather than to an operating system.
IPMI Browser retrieves data from servers using IPMI protocol, shows charts with temperature sensors, voltage,
current, fans speed. Also you may check all available counters (e.g. disk status, memory errors) with details: value, lower and upper thresholds,
critical and non repairable thresholds; export data into text file, etc
New test methods
- RMCP Ping - this test uses Remote Management Control Protocol (RMCP)
to verify connection to remote servers. Unlike (ICMP)Ping this test method may check powered off servers. Note: not every server supports RMCP and IPMI protocols.
- IPMI Health - this test method uses IPMI protocol in order to check
target server for power related problems, fans and drives faults, detect chassis intrusion.
Note: we will add more IPMI related test methods in version 12.80
Send e-mail action improvements
- You can specify optional [cc:] and [bcc:] lists in "Recipients" field. e.g.
admin@company1.com [bcc:] manager@company1.com
admin1@dom1.com; admin2@dom1.com [cc:] manager@dom1.com [bcc:] hr2@dom1.com; hr5@dom1.com
- HostMonitor adds "HostMonitor runs in EVALUATION mode" note to e-mail messages when software is not
registered properly. This helps to detect problem when registration lost for some reason (e.g. due to major Windows 10 update; or when you
installed new version of HostMonitor while your free updates term expired and you missed warning displayed by "update check" window).
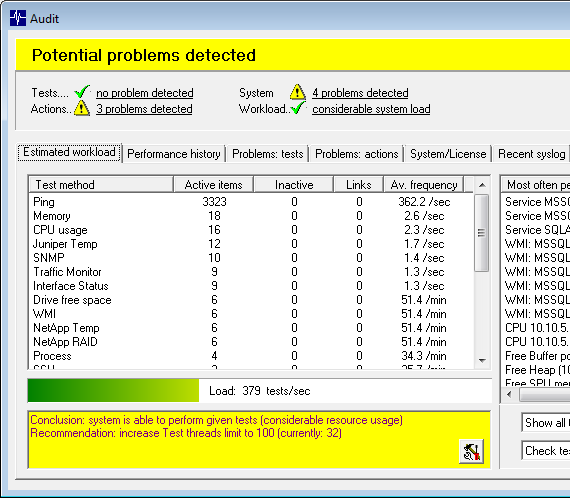
As usually we recommend to start Auditing Tool (menu View) from time to time; it may detect many system and configuration related problems
GUI improvements
- You may press Ctrl+A in order to select all visible test items in test details area
- HostMonitor and RCC offers more items in menu Tools. You may start Disk Meter, Process Meter, WMI Explorer,
MIB Browser, IPMI Browser, System info, Log Analyzer to explore resources on specific host. If RCC installed on remote systems, you may
copy DiskMeter.exe, IpmiBrowser.exe, MibBrowser.exe, ProcessMeter.exe, WmiExplorer.exe modules to RCC system as well.
- Menu Tools->Recent keeps history of recent actions. E.g. you may check disk space on HostA using SuperMatrix window,
check processes on HostB using Network Map, call IPMI Browser from main window - all these commands will be stored in Tools->Recent menu.
 youtube video
The following issues were resolved
- For some reason ESET antivirus software may set "kernel not running" status while antivirus service is running and
working properly. Now Antivirus Status test in "ESET" testing mode ignores "kernel not running" error and sets Ok status (unless other problems detected)
- When Cisco Health test performed by RMA agent detects some problem it shows problem description in Reply field but
it could keep Ok test status. Fixed, now test sets Bad status when problem detected, just like test performed by HostMonitor
|
|
|
HostMonitor and RMA improvements
- Antivirus Status test: new test modes allow checking the following software:
- Kaspersky Security for Windows Servers
- ESET Endpoint Security
- ESET Mail Security for Microsoft Exchange
- ESET File Security For Windows Server
HostMonitor may check status, license expiration and database age.
- Minor GUI improvements related to Test Properties dialog
- wider test name and comment fields;
- Alt+Left and Alt+Right hot keys allow to discard changes and move to previous/next test item;
- Shift+ALT+Left, Shift+ALT+Right hot keys allow to save changes and move to previous/next test item
- "Tune up Reply" improvements related to JSON strings processing
Web Service improvement
You may start compact or tiny interface using optional URL parameters mobile=1 or mobile=0.
E.g.
host/ws1/compact.htm
host/ws1/compact.htm?mobile=1
host/ws1/compact.htm?mobile=0
host/ws1/links.htm
host/ws1/links.htm?mobile=0
host/ws1/tiny.htm
host/ws1/tiny.htm?mobile=1
The following issue was resolved
- Some SNMP enabled devices (e.g. Cisco N5K-C5672UP) in SNMPv3 mode with enabled encryption (privacy) may
send SNMP packets with "junk" data. SNMP Get, SNMP Table, Network Traffic, Network Interface Status tests could cause high CPU load
while processing such packets.
Fixed HostMonitor, RMA, MIB Browser.
|
|
|
Improvements
- HostMonitor: Windows Updates test also checks for "pending reboot" flags
- HostMonitor: "host related" variables. You could setup actions using variables related to the
test that trigger the action (so you could use the same action profile for many different test items) and you could setup actions
referring to some other specific test items using variables like %::MainWebServer_CPU::Status%.
Now you can setup actions using variables that refer not to some specific test (like
"CPU test for MainWebServer") but rather to test items that check the same host - HostMonitor will search for test items
related to the host that triggered this action execution. E.g. if you setup CPU Usage, Memory and Dominant Process tests
for Host01, Host02 .. Host99, then you may setup single alert profile with "Send e-mail" action using HTML template like:
E-mail triggered by %TestName%<br>%Status%<br>%Reply%<br><br>
%::RelatedTests::short_table%
- or -
E-mail triggered by %TestName% %Status% %Reply%<br><br>
Related tests:<br><br>
%::RelatedCPU::short_table%<br>
%::RelatedMemory::short_table%<br>
%::RelatedProcess::short_table%
Then if any CPU Usage test (e.g. "CPU Usage for Host05" test) will change status from Ok to Bad and trigger assigned actions,
HostMonitor will find Memory and Dominant Process tests related to the same Host05 and you will get e-mail with information
about CPU load, memory usage and information about process(es) that use the most of system resources (CPU, memory, Handles, etc).
More details..
- HostMonitor: "Send SMS (GSM)" action: new variables for custom scripts (when "custom" modem type is used):
%Message0PDU%
%MessageSCAPDU%
- Web Service: various improvements related to "old" (host/ws1/index.htm) and "compact" (host/ws1/compact.htm) interfaces
|
|
|
New test methods
- Antivirus status test can check built-in or 3rd party antivirus and antispyware software running on local or remote Windows systems.
- Windows updates test can check system updates on local or remote Windows hosts.
|
|
|
Improvements
- Restart Service action behavior changed. If you setup one action to restart several services, e.g. service-A,service-B,service-C then
HostMonitor will perform the following operations:
- stop service-A
- stop service-B
- stop service-C
- wait
- start service-C
- start service-B
- start service-A
(old version would stop&start service-A, then service-B, then service-C)
- Minor improvements related to Domain Expiration test
- %FilePath% variable for actions triggered by Count Files test (full path without filemask)
- %FilePath% variable for actions triggered by Folder/File Size test
- %TestMode% variable for Count Files test templates
- %AllParams% variable for ShellScript test templates
- Various GUI improvements
|
|
|
New applications
- Active RMA for FreeBSD (x64)
- WatchDog for FreeBSD (x64)
Improved Active RMA for Linux (x64)
- Ping test improvements: test shows error in Reply field when RMA does not have necessary capabilities (like Trace test)
- Support new %SmallestFile% and %LargestFile% variables for file related tests (File Availability, Folder/File Size, etc)
- Remote Upgrade procedure improvements (using RMA Manager)
Improved RMA for Windows (Passive RMA and Active RMA, x86 and x64 versions)
- Support new %SmallestFile% and %LargestFile% variables for file related tests (File Availability, Folder/File Size, etc)
- Support new %SmallestFile% and %LargestFile% variables for FTP, FTPS, SFTP test methods
- ODBC test may retrieve 2 different fields
HostMonitor GUI improvements
- Various improvements related to SuperMatrix window
- Results History window allows resizing ("historical" charts for set of several selected test items)
HostMonitor test improvements
- %SmallestFile% and %LargestFile% variables support for file related tests (File Availability, Folder/File Size, etc)
- %SmallestFile% and %LargestFile% variables support for FTP, FTPS, SFTP test methods
- ODBC test may retrieve 2 different fields. HostMonitor may check value of field1 and display value of field2 or display field1 or it may display both fields.
- ODBC test: new variables %ODBCField1% and %ODBCField2% provide access to retrieved data;
variables can be used in Optional status processing expressions or as parameters of actions assigned to ODBC Query test
|
|
|
New applications
- Active RMA for Linux
- GUI, console and daemon modes
- Supports over 70 test methods
- May receive and forward SNMP Trap messages to HostMonitor
- Not available for FreeBSD, Solaris, macOS and AIX yet (there is old RMA for such systems)
- details
- WatchDog for Linux (details)
Improved RMA for Windows (Passive RMA and Active RMA, x86 and x64 versions)
- Remote Upgrade procedure improvements (using RMA Manager)
- Trace test provides more details in case of some problems, e.g. test may add message like "target not reached within N hops" to the route string when TTL parameter is set too low
- Radius and DICOM tests corrections (only x64 version of the agent was affected: in some cases tests could fail)
HostMonitor/RCC improvements
- Trace test provides more details in case of some problems
- Test Properties dialog: minor improvements, e.g. when you view/edit test item, you may use hot keys Alt+LeftArrow, Alt+RightArrow in order to move to previous/next test item
- Shell Script Manager: you may set fonts used for script, comment and history pages.
You may add the following lines into [Environ] section of hostmon.ini file and restart HostMonitor (for example use Consolas and Lucida Console fonts)
ScriptFontName=Consolas
ScriptFontSize=9
sCommentFontName=Lucida Console
sCommentFontSize=9
- Shell Script Manager: various GUI improvements
RMA Manager
- Minor GUI improvements
- RMA Upgrade procedure improvements
|
|
|
Performance improvements
If you set Private logs for 10,000 test items and tell HostMonitor to set new log files on daily basis, then you will have 300,000 log files
just in one month; 3,650,000 log files per year. Then Log Processing module could slow down HostMonitor during some operations, especially
when HostMonitor needs to start external programs many times in a row (in order to modify a lot of these log files).
New version uses low priority thread usually started after midnight to process log files. You may set specific time for log processing using
DailyTime parameter in [Logging_PrivProcessing] section of HostMon.INI file (e.g. DailyTime=0222 tells to start log processing at 2:22 AM).
Note: the following options (when set) can trigger log processing commands during daytime:
- if common log is switching
- if private logs is bigger than N KB
usually this is not a problem, these commands will process just 1 log file, not 300,000 files
Test improvement
SOAP test may resolve date/time variables in Parameters field
RMA/x64
As you know Remote Monitoring Agents (RMA/x86) for Windows included into Advanced Host Monitor package. x86 agents work fine on any 32-bit
and 64-bit Windows systems starting from Windows XP to Windows Server 2019 (we do not test Windows NT and Windows 2000 anymore). However
in some cases you may need 64-bit version of the agent. For example you may need to use some 64-bit ODBC driver (for ODBC Query test)
because 32-bit version of ODBC driver is not available.
RMA/x64 can be downloaded as separate package (not included into Advanced Host Monitor installation package); you may replace x86 version
of Passive and/or Active RMA agents using rma.exe and rma_active.exe modules from rmawin64.zip archive.
RMA x64 comes with x64 version of OpenSSL 1.1.1 (files: libcrypto-1_1-x64.dll and libssl-1_1-x64.dll)
Drawback: Active Script test does not work in 64-bit mode because Microsoft does not offer 64-bit version of msscript.ocs.
There are some 3rd party replacements but we could not find reliable one. Shell Script tests work fine.
Tools/x64
Also 64-bit version of Disk Meter, Process Meter, MIB Browser and WMI Explorer available on download page
The following issue was resolved
- MIB Browser: Charts window: autoscale did not work properly for numbers between 10 and 15. Fixed
|
|
|
GUI improvements
- HostMonitor and RCC: History dialog offers options to hide maximum, average and minimum replies
(e.g. you may display just minimum values for Memory tests and display maximum plus average values for CPU Usage tests)
Performance improvements
HostMonitor, RCC and RMA: new SNMP v3 related code (encryption) works faster and uses less CPU resources. The following test methods work faster:
- SNMP Get
- SNMP Table
- Traffic monitor
- Interfaces status
- CPU Usage (SNMP mode)
- Memory tests (SNMP mode)
- Disk Free Space (SNMP mode)
- Process (SNMP mode)
- Cisco related tests
- Juniper tests
- F5 Big-IP tests
- Netscaler tests
- NetApp tests
- QNAP tests
- Synology tests
- UPS related tests
The following tools and applications work faster:
- Network discovery works faster with SNMP v3 encryption
- System Info: SNMP v3 related functions work faster
- MIB Browser: SNMP v3 encryption works faster
- DiskMeter: SNMP v3 encryption works faster
Note 1: SNMP v2c related code was not changed, its pretty fast (no encryption);
Note 2: as usually we do not recommend 3DES encryption mode. 3DES slower and less secure than AES encryption
Tests and actions
- URL test: 201, 202 reply codes are not considered as bad answer
- HTTP request action: 201, 202 reply codes are not considered as bad answer
- %NTEventTextNoQuotes% and %PrevNTEventTextNoQuotes% variables replace CR, LF characters with space
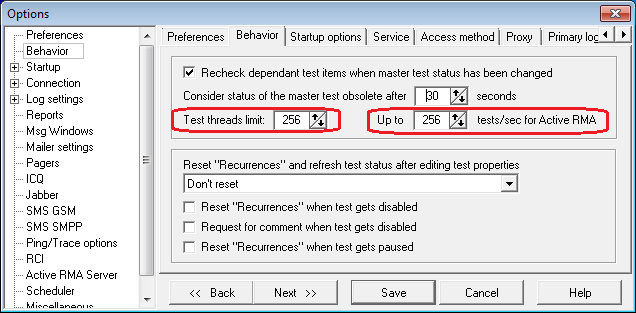
Auditing Tool
- Minor improvements related to prediction and recommendations
The following issue was resolved
- HostMonitor v12.20-12.32 in rare cases could stop monitoring
|
|
|
HostMonitor Optional status processing improvements
- You may use new csvfield and tsvfield operators for [Tune up Reply value], [Use Normal status], [Use Warning status] expressions. E.g.
Use Normal status if ('%suggestedreply%' csvfield 2)+('%suggestedreply%' csvfield 4)>100
Tune up Reply value = ['%suggestedreply%' csvfield 2]
HostMonitor and RMA for Windows improvements
- Text Log test: increased speed for "string" and "simple expression" search modes
- Text Log test: implemented new "expression" search mode. E.g. you may use expressions like
('%data%' csvfield 2) + ('%data%' csvfield 4) > 100
('%data%' tsvfield 2 > 50) and ('%data%' tsvfield 4 > 160)
('%data%' getword 1 == 'error') and ('%data%' getnumber 1 >= 500)
- File Integrity test: about 15% faster CRC32 mode
- File Integrity test in MD5/SHA modes could ignore data past 4GB (some large files were checked correctly but not all; in CRC32 mode all files were checked correctly). Fixed
RMA for UNIX improvements (v 1.36)
- Text Log test: increased speed for "string" and "simple expression" search modes
- Text Log test: implemented new "expression" search mode, supported expressions like
('%data%' csvfield 2) + ('%data%' csvfield 4) > 100
('%data%' tsvfield 2 > 50) and ('%data%' tsvfield 4 > 160)
('%data%' getword 1 == 'error') and ('%data%' getnumber 1 >= 500)
- Compare Files test: increased speed
- File Integrity test: increased speed for all modes (CRC32, MD5, SHA256, SHA512)
|
|
|
- HostMonitor and RMA for Windows: faster Text Log test method
- HostMonitor and RCC: corrections for "same scale for all charts" option (multi-test history dialog)
|
|
|
- HostMonitor: minor GUI improvements
- HostMonitor and RMA: minor Synology Health test adjustments
- HostMonitor and RMA: some IMAP and LDAP tests related corrections (e.g. test could show "No answer" status instead of "Unknown host" status)
- Passive and Active RMA for Windows: reduced CPU usage in application mode, especially on Windows 10 systems (as usually service mode is preferred when high load is expected)
- Web Service: several corrections related to Network Map pane
|
|
|
Log Analyzer improvements:
- TXT, HTML and ODBC logs analyzing about 5-10% faster
- DBF log files analyzing about 30% faster
- Full screen chart about 10% faster
- Reports with charts about 30% faster
- Log Analyzer uses PNG images instead of GIF image files
HostMonitor and RMA improvements related to System Info feature for local Windows systems (domain members)
The following issues were resolved
- Temperature Monitor test: in some cases HostMonitor could not get data from Sensatronics EM1 devices using "all probes" test mode. Fixed
- Remote Exec and Remote Kill actions: HostMonitor did not resolve variables in "hostname" field. Fixed
- Fixed issues related to System Info feature (some data collected by RMA agents could not be parsed by HostMonitor)
|
|
|
HostMonitor improvements:
- Send message to pager (SNPP) action supports SSL/TLS connections
- minor GUI improvements
- minor performance improvements
Installer improvements
The following issues were resolved
- HostMonitor version 12.20-12.24 could get wrong credentials from Connection Manager when tests performed by RMA agents. Fixed
- If you are using Service tests with "Alert when some Auto services are not running" and
"Skip services" options, then in some cases "Start service" action could not start some of stopped services. Fixed
|
|
|
HostMonitor tests improvements:
- NTP/SNTP test: in some cases test could set Bad status without explanation. New version will show problem description
in Reply field. E.g. "clock not synchronized" error message means the host's NTP service is not synchronized to any remote server (HostMonitor can
show such Bad status even if time is correct, so far)
- Drive Free Space: minor improvements for "Import from text file" procedure
GUI improvement:
- HostMonitor and RCC: "Same scale for all charts" option available when you open "History" dialog for several test items and set Performance mode
- LogAnalyzer: about 10% analysis speed increase
- WatchDog: now application uses the same scale for tests, actions and logging charts
(unless there are big difference in results). E.g. If maximum 40 tests/sec, 5 actions/sec and 10 records/sec were performed during displayed
time interval then WatchDog will set scale for all 3 charts to 50. If 290 tests/sec and 25 actions/sec were performed, then tests chart scale
will be set to 300; actions charts scale to 50
The following issues were resolved
- HostMonitor version 12.20 and 12.21 could work incorrectly with Backup Active RMA agents when "Load balancing 50/50" mode used. Fixed
- RMA Manager: in rare cases it could set wrong status when you import RMA agent settings from CSV file. Fixed
|
|
|
|
|
|
|
- Improved Web Service
- 12 new test methods
- 7 new actions
- 4 improved test methods
- Automatic backups
- New authentication option for Remote Control Console
- Remote Monitoring Agent (RMA) for Rasberry PC Pi4
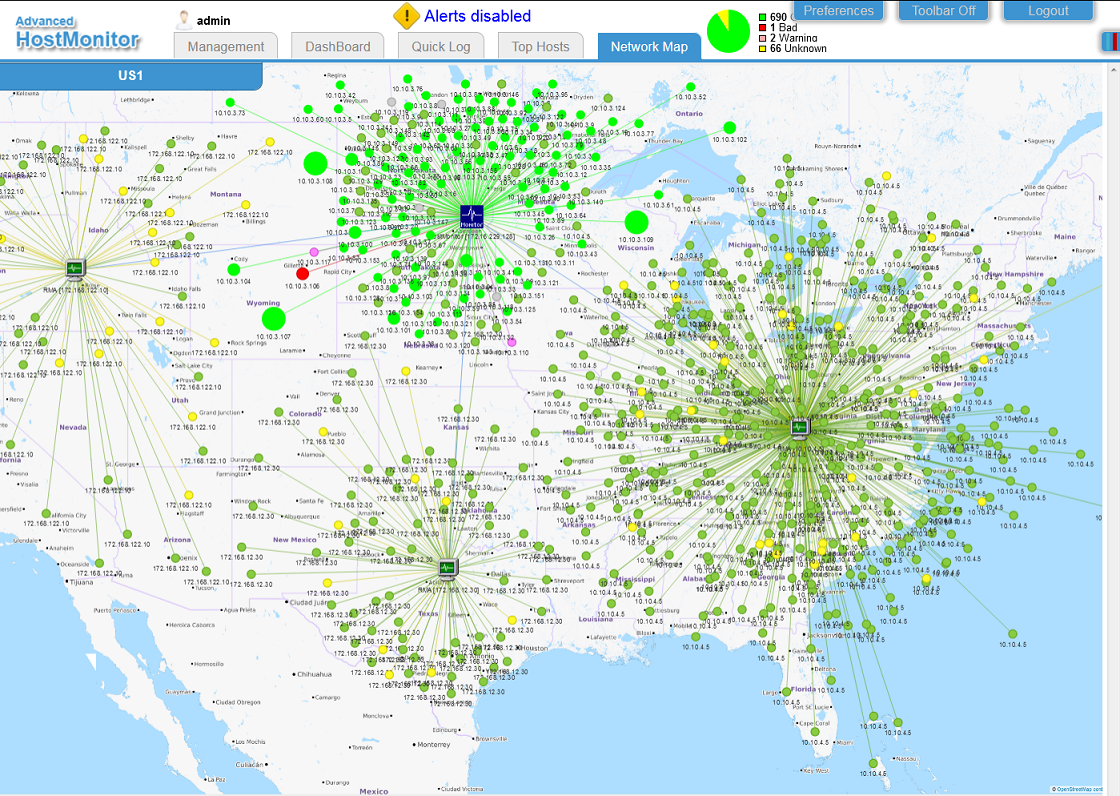
New "Network map" pane (Web Service)
Web Service may group all tests related to the same host, set links between different hosts depending on HostMonitor-RMA and Master-Dependants relations and display HostMonitor, RMA agents and all hosts on interactive map.
 youtube demo youtube demo
Gravity and Spiral. Web Service may set initial positions for the elements using "Gravity" and "Spiral" algorithms. Spiral works much faster so we
recommend this method when you are monitoring thousands of hosts. Actually you may use both methods - init entire WAN map using Spiral algorithm,
then select some part of the map (e.g. click on RMA agent to select agent and all hosts monitored by this agent) and apply Gravity algorithm for this LAN.
Note: Spiral algorithm will reset entire map, while Gravity algorithm may work with entire map or selected subset (e.g. RMA agent with hosts or Master test
with dependent items).
When you click on Gravity button, button caption changes to "Stabilize/Stop" and you may click it again when map looks "good enough" without waiting
for algorithm to complete.
Then you may manually adjust position of any element (standard drag&drop). If you drag master item and hold the button depressed, interface will
rearrange dependant items using Gravity algorithm; release mouse button to stop this process at any time.
Rotate left / Rotate right - these buttons may work with entire map or with selected segments (just like Gravity button).
Undo and Redo buttons help to fix mistakes.
Zoom - use mouse wheel to zoom in / zoom out.
Background images
You may set comment, load background image (select image from drop-down list and click "Set map background" button), then save map settings using Save
or SaveAs buttons.
Some background samples located in WebService\mapsbg\ folder, images based on data provided by OpenStreetMap (http://www.openstreetmap.org/copyright).
You can create your own images to fit your company standards and copy files into this folder.
Items
Item color depends on status of all tests related to the host. E.g. green means all tests have "good" status (and may be some disabled tests);
yellow means there are some tests with "unknown" status; pink - warning tests; red - there are some "bad" tests;
orange - there are some "bad", "warning" or "unknown" items, all of them acknowledged; grey - all tests disabled.
Size of the item depends on number of tests related to the host.
Click on the host (right mouse button) and you will see test items related to the host: test name, last reply and average reply value.
Then you may select test and use popup menu (right mouse click again) to enable, pause, resume test, acknowledge test status, check quick log,
check performance history and so on.
Improved Top Hosts pane (Web service)
WebService may adjust long test names trying to fit text in the window, for example it can display "C: on server5" instead of full test name "Free Disk Space C: on server5"
| Added new groups: |
| - System: Hottest system/CPU | QNAP, Synology, NetApp, Cisco, Juniper and HP iLO Temperature tests |
| - HDD: Highest disk load | Synology Disk Load and Windows Performance Counter ('% Disk Time') tests |
| - UPS: Highest load | UPS Load tests |
| - UPS: Highest temperature | UPS Temperature tests |
| - UPS: Lowest charge level | UPS Charge tests |
| Improved groups: |
| - HDD: Hottest disk | includes QNAP Temperature, Synonoly Temperature and HDD Smart tests |
New test methods (HostMonitor/RMA for Windows)
| - WebDav Free Space |
Web Distributed Authoring and Versioning (WebDAV) protocol provides a framework for users to create, change and move documents on a server.
WebDAV servers are frequently deployed with quota (size) limitations. This test method checks amount (or percentage) of free space and may trigger
alerts when free space falls below specified limit |
| - SIP | monitors target servers using Session Initiation Protocol requests over UDP, TCP or TCP+TLS protocols |
| The following test methods check health of F5 BIG-IP network devices using SNMP protocol |
| - Big-IP Health | checks overall health: status of the disks, power supply status, fans status, failover and sync statuses |
| | - Big-IP Temperature | checks chassis, CPU, blade temperature sensors, sets Bad status when temperature exceeds specified limit |
| | - Big-IP Statistics | allows to checks various metrics, like
- Current connections
- SSL connections
- Connections/sec
- Dropped packets ratio
- HTTP requests/sec
- HTTP errors ratio
- HTTP Cache hits ratio
- DNS requests/sec
and much more |
| | - Big-IP Free Space | this test may check several drives on target system and find drive with minimum free space or drive with minimal percentage of free space |
| | - Big-IP CPU Usage | checks the percentage of CPU utilization |
| | - Big-IP Memory | checks available memory on the device (Total, TTM memory, non-TTM, Swap) |
| | The following test methods check health of Citrix Netscaler network devices using SNMP protocol |
| - Netscaler Temperature | checks internal, CPU and auxiliary temperature sensors, sets Bad status when temperature exceeds specified limit |
| - Netscaler Statistics | allows to checks various metrics
- Current connections
- Connections/sec
- SSL connections ratio
- SSL cache hit ratio
- SSL current queue size
- HTTP requests/sec
and more |
| - Netscaler CPU Usage | checks the percentage of CPU utilization; also it may check utilization of the hardware crypto chip (N3 chip, if installed) |
| - Netscaler Memory | checks amount or percentage of free memory on NetScaler device |
New actions (HostMonitor)
| - Start program remotely | executes external program on remote system |
| - Kill process | kills process on local or remote system |
| - Slack message | sends a message to Slack messenger channel |
| - Viber message | sends a message to Viber client |
| - Hangouts chat | sends messages into Google Hangouts chat |
| - Microsoft Teams | sends a message to Microsoft Teams channel |
| - Telegram message | sends a message to Telegram messenger chat |
New variables (HostMonitor)
New variables:
- %Reply_AsIS%
- %LastReply_AsIS%
- %SuggestedReply_AsIS%
Automatic Backups (HostMonitor)
HostMonitor may create backup copies of all data files once a day and/or once a week; keep last N daily and/or weekly copies; remove old archives,
start actions when backup procedure failed, etc.
You may adjust backup options or restore settings from archive using menu File->Backup options (you should use user account with
"backup/restore operations" permission; by default only admin account has such permission, you may adjust account settings and permissions using menu
User->Operators).
Also HostMonitor may backup your VB and Java scripts, HostMonitor script files (.HMS, .VBS, .JS, .PS1, .CMD, .BAT files). If you are using some
external scripts for tests or actions, we recommend storing them in Scripts subfolder within HostMonitor data folder (e.g. C:\ProgramData\HostMonitor\Scripts\).
Note: compression and encryption for archives will be implemented soon.
youtube demo
Windows authentication (HostMonitor/RCC)
Now you may set "HM or Win authentication" status to user accounts (operators). In such case remote RCC operator may choose "Windows authentication"
option and connect to HostMonitor without providing username/password. Windows authentication mode can be used when HostMonitor and RCC started on
domain systems (not workgroup).
Note: in order to use Windows authentication mode while HostMonitor running as service you should set user account for the service using Windows "Services" applet
(do not set user account using HostMonitor Options dialog).
Windows account on HostMonitor side can be specified as domain\user or just user (in case of single domain). E.g. if operator logged in to Windows
system and started RCC under "DOMAIN1\manager123" name, then either "DOMAIN1\manager123" or "manager123" operator account should be created on
HostMonitor side (User->Operators)
RMA
Remote Monitoring Agent (RMA) for Rasberry PC Pi4 (Ubuntu)
The following issues were resolved
HostMonitor
- URL test with "download frames" option could miss IFRAME tags. Fixed
- DNS test did not work in TCP mode. Fixed
- Memory test for Linux
Net-SNMP-Libs starting from version 5.7.2-43 on RedHat/CentOS/Fedora systems sets memAvailReal counter to the available memory while older
versions of Net-SNMP sets this counter to amount of the free memory.
New HostMonitor/RMA checks Net-SNMP version and adjust calculations depending on version, this way Memory test should work properly for any system
with Net-SNMP version below 5.7.2 and above 5.7.2 (e.g. 5.7.3). Unfortunately SNMP agent does not provide full version so it's impossible to
determine behavior for 5.7.2.xx subversions, however HostMonitor should be able to get correct data in most cases using any Net-SNMP 5.7.2.xx
(in same cases it will not be 100% accurate)
- Service test, "Alert when some Auto services not running" testing mode: in some rare cases it could set Unknown status with "not found" error message. Fixed
WatchDog
- sometimes it could drop connection to HostMonitor (and then reconnect). Fixed
|
| |
Archive:
versions 11.00 - 11.98
versions 10.00 - 10.70
versions 9.00 - 9.90

Copyright (c) 2000-2022 by Advanced Network Software. All Rights Reserved
| |